Databricks Tips #16: Data Quality — dynamic expectations, quarantine, and DQX
Databricks Tips
Data Engineering
Warn is the default and filters nothing: how to go from scattered checks to a quality system in Databricks, with rules loaded dynamically from a Delta table, a quarantine that loses no records, post-write monitoring, and DQX from Databricks Labs.
You set up expectations in your pipeline, the graph runs green, and the quality metrics pile up in the event log. And yet the silver table has negative amounts. It’s not a bug: warn is the default action of an expectation, and warn filters nothing. The invalid record adds one to a metric nobody looks at, and gets written anyway.
In Tips #11 we covered expectations as just another feature of Lakeflow pipelines, the product formerly known as Delta Live Tables (DLT for the rest of this post). This post takes them as the starting point to build the full system: the traps that don’t show up in the tutorial, rules defined as data instead of code, a quarantine that loses no records, statistical monitoring after the write, and DQX, the Databricks Labs library that covers what happens outside a pipeline.
NoteTL;DR
- Expectations validate record by record inside a pipeline with three actions: warn (default, writes anyway), drop (discards) and fail (rolls back the update). The basics are in Tips #11; here come the traps.
- Rules can live as data in a Delta table (or in Lakebase, if an app edits them) and load dynamically with Python: one single place for the rules of all your pipelines. Python only; SQL doesn’t support dynamic loading.
- The official Quarantine Pattern doesn’t use drop: it flags each record with an
is_quarantinedcolumn and splits it into two views, losing nothing and reading the source only once. - Data quality monitoring (what used to be called Lakehouse Monitoring) adds the statistical, post-write side: anomaly detection (freshness and completeness) and profiles with drift.
- DQX, from Databricks Labs, takes the checks to any DataFrame, inside or outside pipelines, with quarantine out of the box and the why behind each rejection, row by row. It’s pre-1.0: pin the version.
1. The map: four mechanisms, four moments
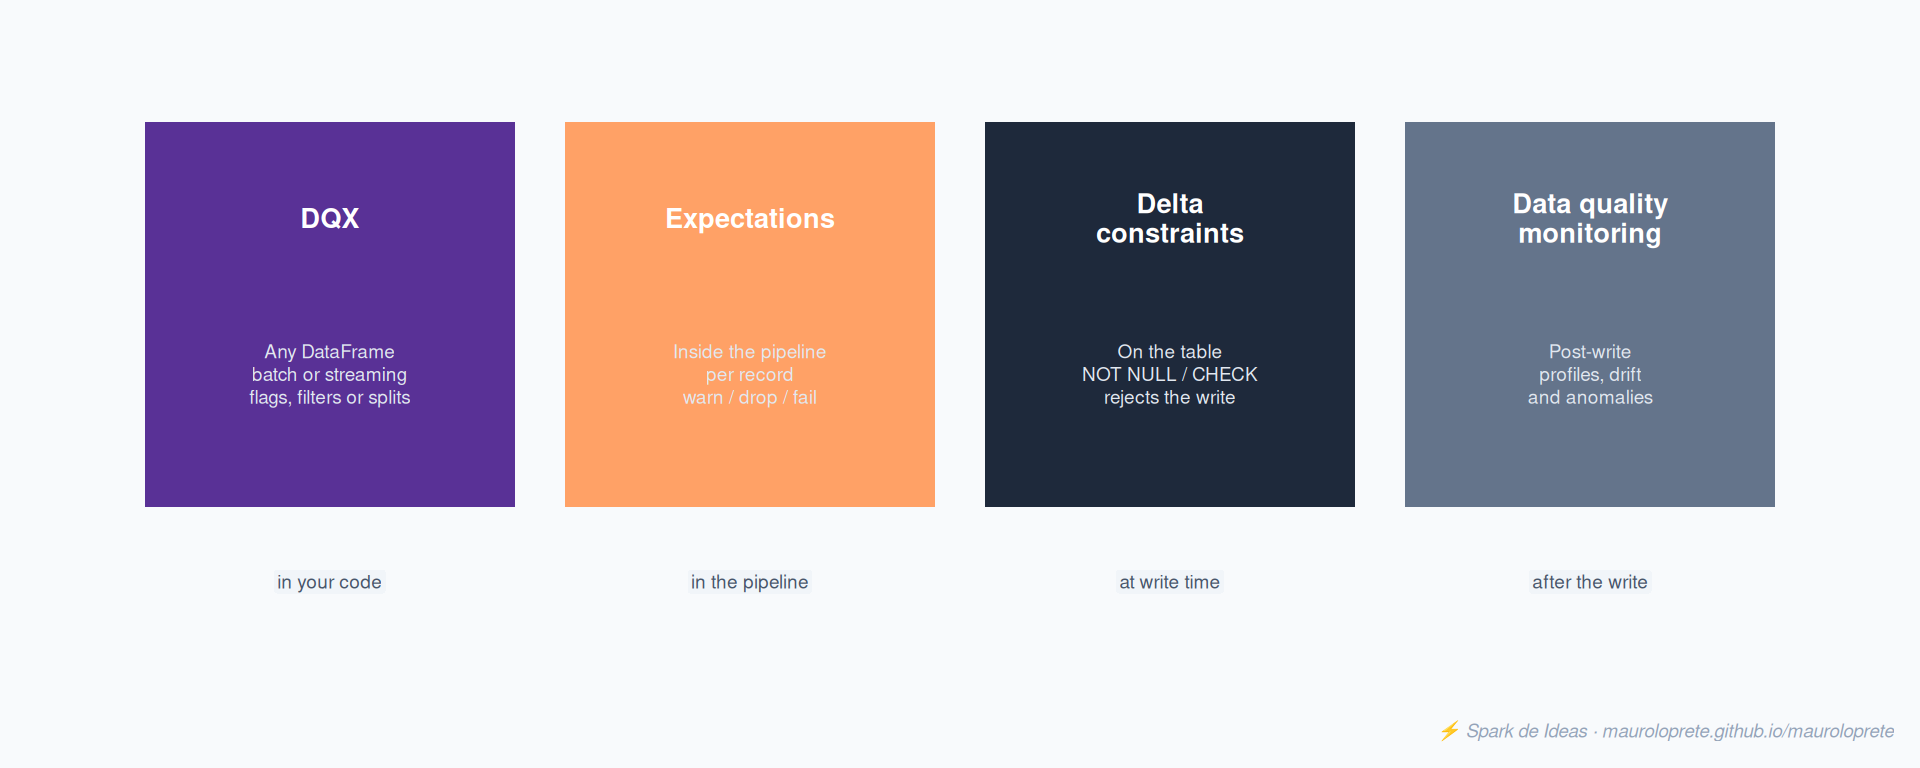
“Data quality in Databricks” is not one tool, it’s four, acting at different moments of the flow. Picking the wrong one is the source of most frustrations: asking an expectation to validate a historical table, or a monitor to stop an invalid record, is asking the mechanism for something it doesn’t do.
| Mechanism | Where it runs | Granularity | What it does with invalid data |
|---|---|---|---|
Delta constraints (NOT NULL, CHECK) |
On the table, wherever the write comes from | The whole transaction | Rejects the entire write |
| Expectations | Only inside a DLT pipeline | Per record | warn, drop or fail |
| DQX (Databricks Labs) | Any DataFrame, inside or outside pipelines | Per record, with per-rule detail | Flags error columns, filters, or splits into quarantine |
| Data quality monitoring (Unity Catalog) | On the already-written table | Statistical: profiles, drift, anomalies | Observes and alerts, doesn’t block |
Delta constraints are the hardest safety net: if one record violates a CHECK, the entire write fails, not the row. They work as a last-resort guarantee, but not as a quality system: they don’t tell you how many records came in bad or which ones, and a single invalid record kills your job. The rest of the post focuses on the other three mechanisms, the ones that give you visibility.
2. Expectations: the one-table recap and the traps
The full recap is in Tips #11; the essentials fit in one table:
| Action | SQL | Python | Invalid records… |
|---|---|---|---|
| Warn (default) | EXPECT (cond) |
@dp.expect |
Get written anyway, metrics are logged |
| Drop | EXPECT ... ON VIOLATION DROP ROW |
@dp.expect_or_drop |
Get discarded before writing |
| Fail | EXPECT ... ON VIOLATION FAIL UPDATE |
@dp.expect_or_fail |
The update fails and the transaction rolls back |
What wasn’t in Tips #11 are the traps:
- Warn doesn’t filter, and it’s the default. An expectation without
ON VIOLATIONlets everything through. If nobody checks the metrics, you have decorative validation: the “validated” table accumulates garbage with a counter. - Fail leaves no metrics. The update fails before logging, so the event log has no record of how many rows violated the rule. To diagnose, you look at the update error, not the quality metrics.
- Fail rolls back the flow, not the pipeline. Each dataset in the graph is updated by its own flow (the process that refreshes it). In a triggered pipeline, the failure rolls back that flow; the other tables in the graph may have updated anyway. In continuous mode, the flow and its dependents do stop.
- Boolean SQL only. An expectation’s constraint doesn’t accept user-defined Python functions, calls to external services, or subqueries against other tables. If your rule needs that, it’s DQX territory (section 6).
- Expectations don’t orchestrate. A validation table with
expect_or_faildoesn’t block its downstream tables: the graph keeps going. If you need “nothing runs if validation fails”, the official docs recommend splitting validation and processing into separate pipelines coordinated by a job. - What’s already written doesn’t get revalidated on its own. Expectations are evaluated on each record the query processes during an update. In a streaming table with incremental refresh that means only the new data: what’s already in the table doesn’t get validated again unless you force a full refresh (which reprocesses the whole source). In a materialized view, recomputation can revalidate the entire dataset. To validate an existing table without touching the pipeline: DQX or a separate job. (This is the more precise version of gotcha #10 from Tips #11.)
- Not every dataset supports them. Streaming tables, materialized views and temporary views do;
AUTO CDC FROM SNAPSHOTdoesn’t. And on a view the expectation is evaluated only when another dataset queries it, so metrics can be missing or duplicated.
NoteNew in 2026: expectations without a pipeline
Since June 2026 you can declare expectations on standalone materialized views, with the CONSTRAINT ... EXPECT (...) syntax, without defining a pipeline. The “expectations only inside DLT” gap is slowly closing: it’s worth checking the release notes before ruling the tool out for a use case.
3. Rules as data: expectation metaprogramming
In Tips #11 the rules were a Python dictionary sitting on top of the table:
quality_rules = {
    "monto_positivo": "monto > 0",
    "cliente_presente": "cliente_id IS NOT NULL",
}
It works until you have 15 pipelines with the same rules copy-pasted, and one change in business criteria turns into 15 pull requests. The solution the docs themselves recommend is treating rules as data: a Delta table with one row per rule, and a function that loads them when the pipeline is built.
CREATE TABLE gobernanza.calidad.reglas (
  nombre    STRING,   -- rule identifier
  condicion STRING,   -- the boolean SQL constraint
  etiqueta  STRING    -- groups rules by criterion or by table
);

INSERT INTO gobernanza.calidad.reglas VALUES
  ('monto_positivo',   'monto > 0',                 'validez'),
  ('cliente_presente', 'cliente_id IS NOT NULL',    'validez'),
  ('moneda_conocida',  "moneda IN ('UYU', 'USD')",  'validez'),
  ('fecha_no_futura',  'fecha <= current_date()',   'plausibilidad');
from pyspark import pipelines as dp
from pyspark.sql import functions as F
def get_rules(etiqueta):
filas = (
spark.read.table("gobernanza.calidad.reglas")
.filter(F.col("etiqueta") == etiqueta)
.collect()
)
return {fila["nombre"]: fila["condicion"] for fila in filas}
@dp.table
@dp.expect_all_or_drop(get_rules("validez"))
def silver_transacciones():
return spark.readStream.table("bronze_transacciones")The @dp.expect_all_or_drop decorator takes the whole dictionary and applies every rule under the tag. The advantages kick in fast:
- One single place for the rules. Changing a threshold is an
UPDATEto the table (with its Delta history), not a code deploy. - Rules come with history.
DESCRIBE HISTORYrecords every change to the table, and with time travel you can compare versions. Mind the default windows (30 days of history, 7 of data for time travel): for long-term auditing, version the rules separately or extend the retention. - Other teams can propose rules without touching the pipeline repo: writing a row is more accessible than a pull request.
TipThe rules don’t have to live in Delta either
If the rules are managed by an application (a back office where the team edits thresholds, with transactional writes and low latency), that’s exactly the case for Lakebase, Databricks’ managed Postgres: you register the database as a read-only catalog in Unity Catalog and get_rules() reads it like any other table. DQX (section 6) goes the same way: Lakebase is among its official options for storing checks.
WarningTwo pieces of fine print
Dynamic rule loading is Python only: the docs say it explicitly, it can’t be done in SQL. And the rules table is read when the pipeline interprets the source code and builds its graph, not on every microbatch (the docs don’t document any re-read during execution; they do warn the code may be evaluated several times during planning). In practice: don’t count on an INSERT into the rules table changing a running pipeline; the safe moment for a new rule to kick in is the next update.
NoteRules managed in Unity Catalog
Since January 2026, the release notes announce support for storing and managing expectations directly in Unity Catalog tables: centralized, versioned rules shareable across pipelines. It’s the same idea as this pattern, but with first-class platform support.
4. The Quarantine Pattern done right
Drop has a problem you notice late: discarded records don’t go anywhere. The metrics tell you how many left, but when the business asks “show me the rows you rejected this week”, they’re gone.
The answer is the Quarantine Pattern: instead of discarding invalid records, split them into a quarantine table to investigate, fix and reprocess them. In Tips #11 I showed the simple version, which today I’d call improvable: one table with expect_or_drop and another one reading the same source with the inverted filter. It works, but it reads the source twice, and the two condition lists (the rule and its negation) evolve separately until one day they no longer match.
The pattern the official docs recommend solves both with a single read:
from pyspark import pipelines as dp
from pyspark.sql import functions as F

reglas = get_rules("validez")

# A record goes to quarantine if it does NOT pass all the rules
condicion_cuarentena = "NOT({0})".format(
    " AND ".join(f"({c})" for c in reglas.values())
)

@dp.table(partition_cols=["is_quarantined"])
@dp.expect_all(reglas)   # warn: keeps metrics, doesn't filter
def transacciones_marcadas():
    return (
        spark.readStream.table("bronze_transacciones")
        .withColumn("is_quarantined", F.expr(condicion_cuarentena))
    )

@dp.table
def silver_transacciones():
    return (
        spark.readStream.table("transacciones_marcadas")
        .filter("is_quarantined = false")
        .drop("is_quarantined")
    )

@dp.table
def cuarentena_transacciones():
    return (
        spark.readStream.table("transacciones_marcadas")
        .filter("is_quarantined = true")
    )
Three design decisions worth understanding:
- The flag is computed once. The
is_quarantinedcolumn is the negation of the same rules you see in the metrics, generated from the same dictionary. There are no two lists to keep in sync. expect_allin warn mode, on purpose. Here warn is exactly what we want: per-rule metrics in the event log, no filtering, because the filtering is done by the downstream tables using the flag.- Partitioning by
is_quarantinedmeans reading only the valid records (or only the quarantine) doesn’t scan the whole table.
TipThe quarantine is an inbox, not a dead archive
A quarantine table that only grows is a symptom of a half-implemented pattern. The full circuit has three exits: investigate (why invalid records come in), fix (repair the source or transform the record) and reprocess (reinsert the corrected data into the flow). If nobody on your team owns that circuit, the quarantine is a drop with extra storage.
5. What happens after the write: Data quality monitoring
Everything above validates records on the way in. But there are quality problems no per-record check detects: the table that stopped updating yesterday, the daily volume that dropped by half, a column’s distribution that shifted without any individual row being invalid.
For that, Unity Catalog brings Data quality monitoring (this suite’s data profiling is what used to be called Lakehouse Monitoring, if you had it filed under that name). It runs on already-written tables, with managed serverless compute, without touching the pipeline or modifying the monitored tables. It has two legs:
Anomaly detection (in Public Preview) is enabled at the schema or catalog level and watches two things across all their tables: freshness (did this table update when the commit history predicts it should have?) and completeness (does the row volume of the last 24 hours fall within the expected range given the history?). Results land in the system.data_quality_monitoring.table_results system table, and Catalog Explorer shows per-table health indicators. Root cause analysis runs separately: it uses Unity Catalog lineage to reason about dependencies and points to the likely source of the problem in the Root Cause column of the Data Quality Monitoring UI.
Data profiling is configured per table and computes descriptive statistics (nulls, distributions, quantiles) and drift metrics across time windows or against a baseline table: how much the distribution moved compared to last week or to the reference dataset. Three analysis types depending on the table (time series, inference for model outputs, snapshot), two Delta metric tables as output, and an auto-generated dashboard. It supports custom metrics and alerts on the metrics.
When to use this instead of expectations? It’s not “instead”: it’s the other half.
| Question | Tool |
|---|---|
| Is this record valid? | Expectations / DQX, in the pipeline |
| Is this table arriving on time, complete? | Anomaly detection |
| Did this column’s distribution shift? | Data profiling (drift) |
| Is the model degrading its predictions? | Data profiling in inference mode |
NoteCosts and limits
Monitoring runs on serverless and is billed under the shared serverless jobs SKU (SKU is the billing code); in system.billing.usage you identify it with billing_origin_product = 'DATA_QUALITY_MONITORING' for records from February 2026 onwards. Before enabling it on a whole catalog, try it on one schema: bulk enablement at the catalog level takes up to 50 schemas per operation, anomaly detection doesn’t monitor views or foreign tables, and data profiling only works on Delta tables.
6. DQX: quality for what lives outside the pipeline
Expectations have a clear boundary: they live in pipelines (even the standalone materialized views from section 2 are backed by a managed pipeline). The Delta tables you write with classic Spark jobs, notebooks or scripts are left out. That’s where DQX comes in, a Python framework from Databricks Labs, the umbrella of open projects Databricks publishes outside the product (I introduced it in the Databricks GitHub map, and it’s one of the repos I use the most: I validate data between medallion layers with it in production).
DQX applies quality checks to any PySpark DataFrame, batch or streaming, and solves three things expectations don’t:
- It works anywhere: pipelines, jobs, notebooks, even on a full historical table (exactly the case expectations don’t cover).
- It tells you why each row failed: it annotates error columns with the violated rule, instead of an aggregate counter.
- Quarantine out of the box:
apply_checks_and_splitdirectly returns two DataFrames, valid and quarantine, without building the pattern by hand.
The typical flow starts with the profiler, which analyzes a sample of your data and generates candidate rules:
%pip install databricks-labs-dqx==0.15.0

from databricks.labs.dqx.profiler.profiler import DQProfiler
from databricks.labs.dqx.profiler.generator import DQGenerator
from databricks.labs.dqx.engine import DQEngine
from databricks.sdk import WorkspaceClient

ws = WorkspaceClient()
profiler = DQProfiler(ws)
_, perfiles = profiler.profile(df_entrada)

# Generates checks from the statistical profile. Review them before applying:
# they're candidates, not truths.
checks = DQGenerator(ws).generate_dq_rules(perfiles)

# Valid records on one side, quarantine on the other
df_validos, df_cuarentena = DQEngine(ws).apply_checks_by_metadata_and_split(
    df_entrada, checks
)
Checks are defined as declarative metadata (a list of dictionaries or a YAML, the text format for configuration files) and can be stored in a workspace file, a Unity Catalog volume, a Delta table or a Lakebase database. It’s the same spirit as section 3: rules are data, versionable and shareable, not code buried in each job. And it closes the loop with DLT: the generator can emit the rules as expectations to use them in a pipeline.
WarningLabs is not the product
DQX is pre-1.0 (v0.15.0 as of June 2026) and Databricks Labs projects come with no official support and no SLA (service level agreement): they’re maintained through pull requests and issues. The license is the Databricks License, not a license certified by the OSI (Open Source Initiative, the organization that validates open source licenses). None of that stopped me from taking it to production, but it does imply one hygiene rule: pin the version (databricks-labs-dqx==0.15.0) and read the changelog before bumping it, because the API still changes between releases.
7. The lab: rules in a table, quarantine, and metrics
The lab puts the pieces from sections 3 and 4 together in a small, verifiable pipeline: a rules table, a flow with quarantine, and the metrics query against the event log. The full walkthrough lives in spark-de-ideas-labs/tips/data-quality.
Step 1: dirty data on purpose. A bronze table with 10% of known broken records: negative amounts, null customers, and a made-up currency.
CREATE OR REPLACE TABLE lab.bronze.transacciones AS
SELECT
  id AS transaccion_id,
  CASE WHEN id % 20 = 0 THEN NULL
       ELSE concat('cliente_', id % 500) END      AS cliente_id,
  CASE WHEN id % 25 = 0 THEN -1 * (id % 900)
       ELSE (id % 900) + 10 END                   AS monto,
  CASE WHEN id % 50 = 0 THEN 'XXX'
       ELSE element_at(array('UYU', 'USD'), CAST(1 + id % 2 AS INT)) END AS moneda,
  date_add(DATE '2026-07-01', CAST(id % 30 AS INT)) AS fecha
FROM range(100000) AS t(id);
Step 2: the rules table and the pipeline. The rules DDL from section 3 and the is_quarantined pipeline from section 4, as is, with the lab’s real names: the source is lab.bronze.transacciones, the rules are read from gobernanza.calidad.reglas, and the pipeline (serverless, triggered) publishes to lab.dq. The graph: bronze to transacciones_marcadas, and from there silver_transacciones and cuarentena_transacciones. The full update took under a minute.
Step 3: the metrics, per rule. The same event log query from Tips #11, which here finally shows something interesting, because each rule has its own counter:
SELECT
  row_exp.dataset AS dataset,
  row_exp.name AS expectation,
  SUM(row_exp.passed_records) AS pasan,
  SUM(row_exp.failed_records) AS fallan
FROM (
  SELECT explode(
    from_json(
      details:flow_progress:data_quality:expectations,
      'array<struct<name:string, dataset:string, passed_records:int, failed_records:int>>'
    )
  ) AS row_exp
  FROM event_log('<pipeline_id>')
  WHERE event_type = 'flow_progress'
)
GROUP BY row_exp.dataset, row_exp.name
ORDER BY fallan DESC
The output, run against the lab’s pipeline on the serverless warehouse:
dataset                        expectation       pasan  fallan
lab.dq.transacciones_marcadas  cliente_presente  95000    5000
lab.dq.transacciones_marcadas  monto_positivo    96000    4000
lab.dq.transacciones_marcadas  moneda_conocida   98000    2000
Each rule with its counter, exactly the broken records we seeded in step 1: 5,000 null customers, 4,000 invalid amounts, 2,000 unknown currencies.
Step 4: the verification that matters. Count the rows in silver_transacciones plus cuarentena_transacciones and compare against bronze: the sum has to match exactly. That’s the pattern’s contract: nothing gets lost here.
SELECT
  (SELECT count(*) FROM lab.bronze.transacciones)        AS bronze,
  (SELECT count(*) FROM lab.dq.silver_transacciones)     AS silver,
  (SELECT count(*) FROM lab.dq.cuarentena_transacciones) AS cuarentena;
bronze silver cuarentena
100000 92000 800092,000 plus 8,000 gives bronze’s 100,000, exactly. And there’s a detail that teaches more than it seems: the per-rule metrics add up to 11,000 violations, but the quarantine holds 8,000 records. It’s not an error: the metrics count violations per rule and the quarantine counts records, and one record can violate more than one rule at a time (given how we seeded the data, multiples of 50 violate two rules and multiples of 100 violate all three). If you ever audit a quality pipeline and the numbers “don’t add up”, start there.
8. Gotchas
1. The rules table is read when the code is interpreted. get_rules() runs when the pipeline builds its graph, and the docs don’t document any re-read per microbatch. Don’t design assuming an INSERT into the rules table changes the behavior of a running pipeline: the guaranteed moment for a new rule to kick in is the next update.
2. Drop leaves no trace of the data. The metrics count how many records were discarded, but the records are nowhere. If there’s any chance you’ll be asked to see them (audits, claims, debugging), quarantine from day one: migrating later means accepting there’s a period with no evidence.
3. In the new API, each dataset type has its own decorator. With import dlt, @dlt.table created a streaming table or a materialized view depending on the query. In from pyspark import pipelines as dp, @dp.table is the decorator for streaming tables (with a batch query it still creates a materialized view for compatibility, but Databricks recommends @dp.materialized_view for that), and @dlt.view was renamed to @dp.temporary_view. Old code with import dlt keeps working with no migration.
4. The event log and billing still say “dlt”. The Lakeflow rename didn’t touch the schemas: your queries on details:flow_progress and the filters by usage_metadata.dlt_pipeline_id in the system tables don’t change.
5. Anomaly detection has edges. No support for views or foreign tables (the federation ones from Tips #15 are left out), it requires serverless available in the workspace, and bulk enablement at the catalog level goes 50 schemas per operation. If your critical table is a foreign table, automatic monitoring doesn’t reach it yet.
6. Data profiling has its own. Delta tables only, snapshots up to 4 TB, and the time series and inference analyses compute only the last 30 days by default. For a full historical profile you have to ask for it explicitly.
7. Monitoring is billed as serverless jobs. It has no SKU of its own: it shares the serverless jobs one, and in system.billing.usage you separate it with billing_origin_product = 'DATA_QUALITY_MONITORING'. Enabling it on a whole catalog is still a budget decision, not just a toggle: start with the schema that hurts the most.
8. DQX breaks API between releases. Pre-1.0 means the changelog is mandatory reading. Pin the version in your jobs and upgrade deliberately, not by drift of an unpinned %pip install.
9. When to use each mechanism
| You need | Use |
|---|---|
| A hard guarantee at the table level, wherever the write comes from | Delta constraints (NOT NULL, CHECK) |
| Per-record validation inside a DLT pipeline | Expectations |
| The same rules across many pipelines, no copy-paste | Rules in a Delta table + get_rules() (section 3) |
| Keeping invalid records to investigate and reprocess | Quarantine Pattern (section 4), or DQX with apply_checks_and_split |
| Validating DataFrames outside pipelines: jobs, notebooks, historicals | DQX |
| Knowing why each row failed, rule by rule | DQX |
| Finding out a table arrived late or incomplete | Anomaly detection |
| Detecting drift in distributions or model outputs | Data profiling |
| Blocking downstream when validation fails | Separate pipelines coordinated by a job (expectations don’t orchestrate) |
If I had to summarize the criteria in one line: expectations and DQX validate records in motion, monitoring watches tables at rest, and Delta constraints are the seatbelt for whatever slipped past everything else.
References
- Manage data quality with pipeline expectations — Databricks
- Expectation recommendations and advanced patterns
- Python reference: expectations (
dp.expect*) - Data quality monitoring — Unity Catalog
- Anomaly detection (Public Preview)
- Data profiling (ex Lakehouse Monitoring)
- What happened to Delta Live Tables?
- Lakeflow pipelines release notes 2026
- DQX — GitHub (databrickslabs/dqx)
- DQX — official documentation
- Delta Lake constraints (NOT NULL / CHECK)
Other posts in the series
If this post was useful, check the previous Databricks Tips:
- Tips #1: Databricks Asset Bundles — IaC for Databricks
- Tips #2: Delta Lake — the 7 things you wish you’d known
- Tips #3: Unity Catalog — the governance nobody implements well
- Tips #4: Structured Streaming — watermarks, triggers and micro-batch
- Tips #5: MLflow + Unity Catalog — from experiment to model
- Tips #6: Feature Engineering — features that survive production
- Tips #7: Docker on Databricks — custom containers
- Tips #8: Jobs & Workflows — streaming and event-driven triggers
- Tips #9: SQL Warehouses — the compute that turns itself on
- Tips #10: AI Gateway — centralized governance for LLMs
- Tips #11: Lakeflow Declarative Pipelines — declarative pipelines with built-in quality
- Tips #12: Photon — the C++ engine that speeds up your queries
- Tips #13: OpenSharing — sharing without copying
- Tips #14: Liquid Clustering — the replacement for partitions and Z-ORDER
- Tips #15: Query Federation — querying Postgres and MySQL without moving data
Next Tips: dbt on Databricks — SQL-first transformations on the Lakehouse, and what role is left for expectations when the tests live in dbt.