Databricks Tips #14: Liquid Clustering — the replacement for partitions and Z-ORDER
Databricks Tips
Delta Lake
What Liquid Clustering is, why it replaces partitioning and Z-ORDER, the CLUSTER BY syntax (including AUTO), how it gets triggered by OPTIMIZE, and a reproducible lab where the same query goes from reading 30 files to 1.
You picked the wrong partition column six months ago and today you have ten thousand 3 MB files, one folder per value, and queries that still scan half the table. Changing it means rewriting everything. You run OPTIMIZE ZORDER every night to patch the hole, and even so data skipping, the engine’s ability to skip files it doesn’t need, never quite delivers.
Liquid Clustering is Delta Lake’s answer to that pain: a physical data layout technique that replaces both partitioning and Z-ORDER, that you can redefine without rewriting the table, and that with CLUSTER BY AUTO can even pick the columns for you. In this post we cover what it does, the actual syntax, how it triggers, the requirements that matter, and a lab to measure how many files it actually skips.
NoteTL;DR
- Liquid Clustering reorganizes the files of a Delta table according to clustering keys so the engine can discard irrelevant files when filtering (data skipping). It replaces Hive-style partitioning and Z-ORDER, and they don’t combine.
- The base behavior is manual keys (
CLUSTER BY (col), up to 4 columns). You can redefine them without rewriting existing data, something impossible with partitioning. - It’s incremental: enabling it doesn’t reorder history. You run
OPTIMIZE(it only touches what’s needed) and, the first time or when changing keys,OPTIMIZE FULL. CLUSTER BY AUTO(Databricks picks the columns for you) requires Unity Catalog and Predictive Optimization, and doesn’t exist in open-source Delta. Liquid itself is GA (Generally Available, meaning stable and supported) since DBR 15.4 LTS, and has been in open-source since Delta 3.1.0.- In the lab (200 million rows): the same query reads 30 files on the partitioned table and 1 with Z-ORDER or Liquid Clustering. Reproducible experiment included.
- Watch out for the myth: on small tables (<10 TB) more keys can make single-column filtering worse.
1. The problem: why partitions and Z-ORDER hurt
Delta Lake, the default transactional table format in Databricks, stores data as Parquet files plus a transaction log. For a query to read little, the engine uses data skipping: it looks at each file’s statistics (min/max per column) and skips the ones that can’t contain what you’re looking for. The better grouped the values are across files, the more files it can discard.
Historically there were two ways to improve that grouping, and both take their toll:
- Hive-style partitioning: one folder per value of the partition column (
país=UY/,país=AR/, …). It works with low-cardinality columns (few distinct values). Its two classic ailments: the small files problem (partitions with lots of tiny files, expensive to list and read) and high cardinality (partitioning byuser_idgives you millions of folders). And there’s something worse: picked the wrong column → rewrite the whole table to change it. - Z-ORDER: a reordering that groups nearby values of several columns into the same files (it uses a Z-order curve, a way of traversing multi-dimensional space while preserving locality). It improves skipping, but you have to run
OPTIMIZE table ZORDER BY (cols)by hand and it over-rewrites every time, because it’s not incremental: it recomputes over the whole touched range.
In both cases you end up managing your data layout as a manual maintenance chore. Liquid Clustering exists to take that off your plate.
2. What Liquid Clustering is
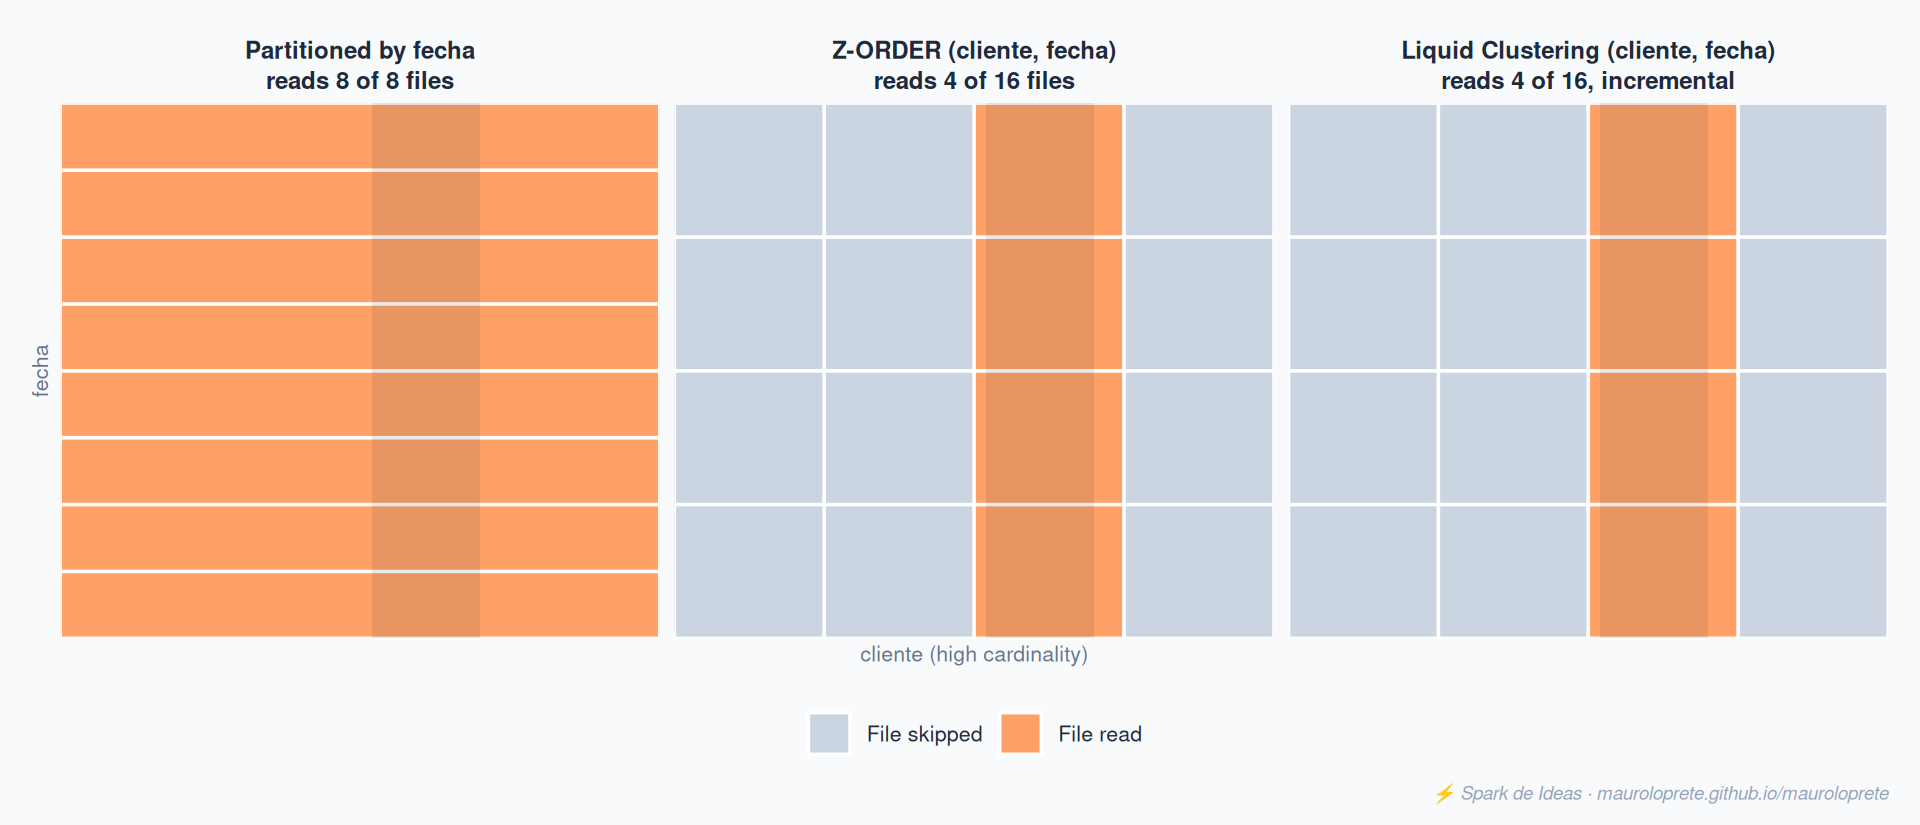
Liquid Clustering is a data layout optimization technique in Delta Lake: you define clustering keys (up to 4 columns) and Delta organizes the files according to those keys to maximize data skipping. The fundamental difference from partitioning:
That example filters by a single column. The real advantage shows when filtering by two: sorting files by one column forces you to read the entire stripe, while clustering in two dimensions lets you read only the file at the intersection.
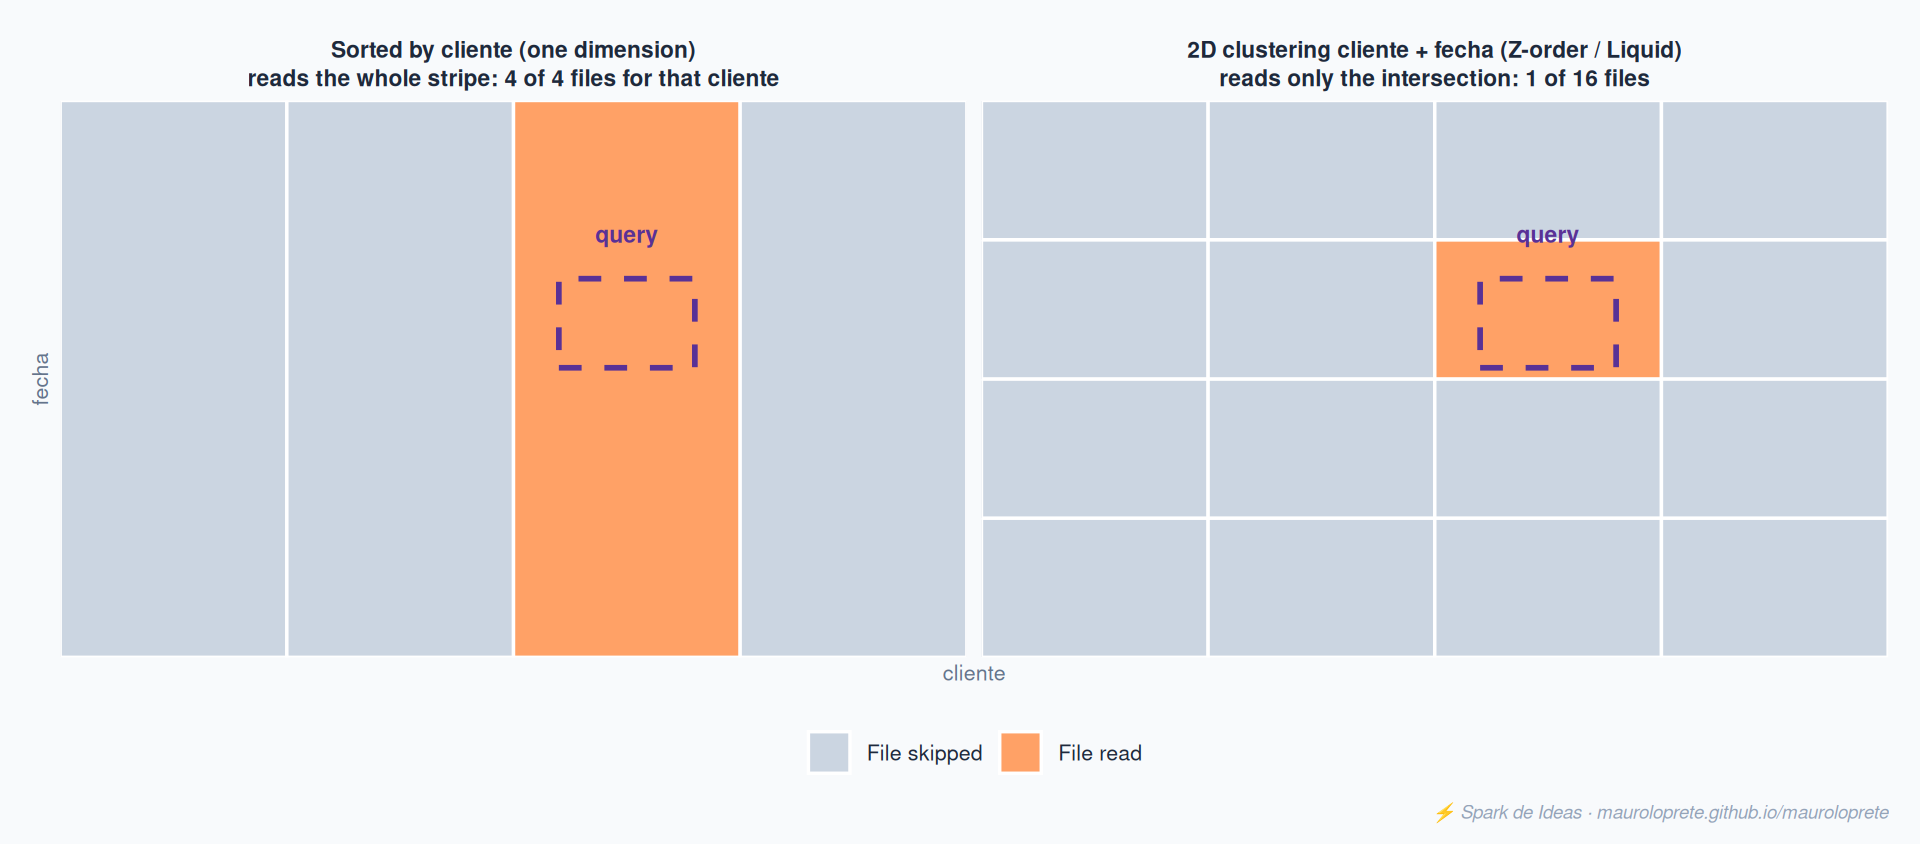
What makes it different: you can change the clustering keys without rewriting existing data. Picked fecha and it turns out you almost always filter by cliente? Redefine the keys and, from the next OPTIMIZE on, the clustering settles around the new ones. With partitions that’s a CREATE TABLE ... AS SELECT of the whole table.
ImportantThe automatic clustering myth
A common misunderstanding (one my own documentation carried): the base behavior of Liquid Clustering does not “learn query patterns and adjust itself”. That’s exclusive to CLUSTER BY AUTO (section 5). In base mode, you pick the keys; what Delta does is maintain the grouping by those keys incrementally.
3. Syntax: the three flavors of CLUSTER BY
The CLUSTER BY clause comes in three flavors. It applies to Databricks SQL and Databricks Runtime (DBR, the cluster’s image of Spark plus libraries) 13.3 LTS and above, Delta Lake only:
-- New table
CREATE TABLE ventas (id INT, cliente STRING, fecha DATE)
CLUSTER BY (cliente, fecha);

-- Existing NON-partitioned table
ALTER TABLE ventas CLUSTER BY (cliente, fecha);

-- Disable clustering (doesn't rewrite already clustered data)
ALTER TABLE ventas CLUSTER BY NONE;
Rules worth having clear:
- Up to 4 clustering keys per table.
- Keys must be columns with collected statistics. By default Delta collects statistics for the first 32 columns of the table. A column beyond the 32nd can’t be a key without adjusting that configuration.
- You can’t cluster by complex types (
StructType,MapType,ArrayType) or their elements. You can by a struct field with dot notation:CLUSTER BY (datos.pais).
WarningPartitioned table: different command
ALTER TABLE ... CLUSTER BY works on non-partitioned tables. If your table is already partitioned, this doesn’t convert it: since DBR 18.1 direct conversion exists, but it’s a different command (REPLACE PARTITIONED BY WITH CLUSTER BY). See section 7 (migration).
4. How it triggers: clustering is incremental
Here’s the part that confuses people the most: enabling clustering doesn’t reorder history. You tell Delta what the keys are, but the data that was already there stays where it was until you run an OPTIMIZE:
-- Clusters incrementally: only rewrites what's needed,
-- doesn't touch files whose keys already match
OPTIMIZE ventas;

-- Forces reclustering of ALL records (DBR 16.4 LTS+)
OPTIMIZE ventas FULL;OPTIMIZEis incremental: it doesn’t touch files that are already well grouped. Cheap to run often.OPTIMIZE FULLforces a complete recluster. Databricks recommends it the first time you enable clustering (to settle the history) or when you change keys.
If you have Predictive Optimization on (the managed service that runs OPTIMIZE and VACUUM on its own based on table usage), Databricks triggers the clustering for you. In that case, turn off any scheduled OPTIMIZE jobs so you don’t duplicate work.
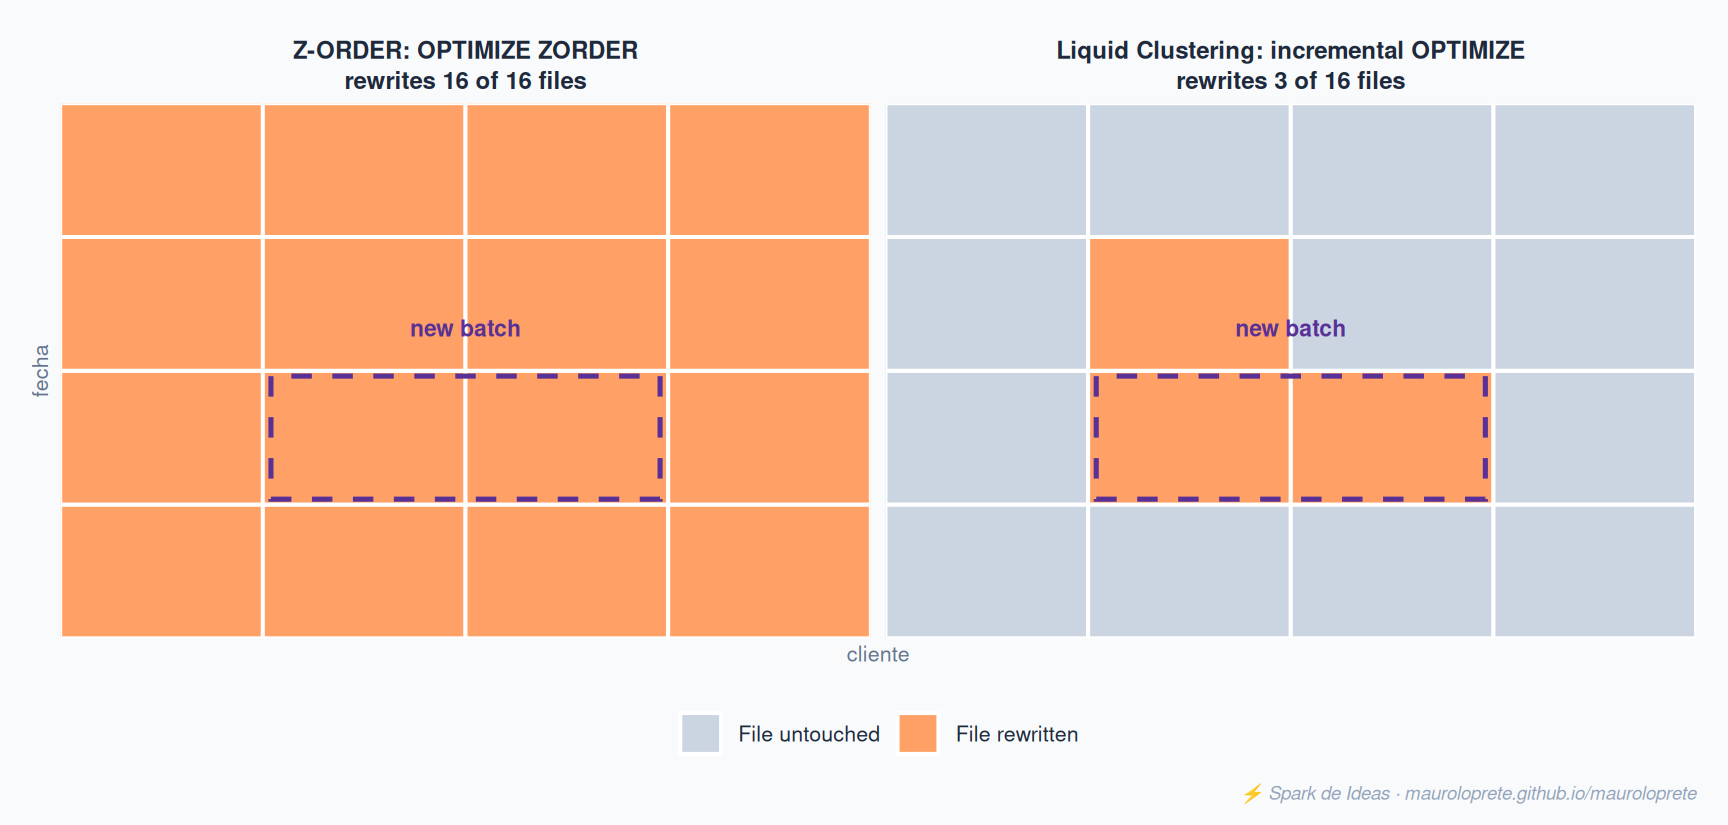
Here’s the real difference with Z-ORDER, which performed similarly on data skipping. When a new batch lands, OPTIMIZE ZORDER reorders the whole set to keep the ordering; Liquid Clustering’s OPTIMIZE touches only the affected files:
NoteUnder the hood: Hilbert curve and ZCubes
Two pieces explain why Liquid Clustering skips better than Z-ORDER while rewriting little. The first is the Hilbert curve, a space-filling curve (a way of traversing a multi-dimensional grid keeping neighboring points close) that Delta uses instead of Z-ORDER’s Z curve, and which improves data skipping. The second is ZCubes: each OPTIMIZE produces a group of already-clustered files and tags them in the Delta log with a ZCube id; the next OPTIMIZE only rewrites the files not yet clustered. That’s why clustering is incremental and doesn’t trigger a full rewrite (write amplification).
5. CLUSTER BY AUTO: let Databricks pick the columns
The automatic mode. Instead of you picking the keys, Databricks picks them based on the table’s actual query patterns:
CREATE TABLE ventas (id INT, cliente STRING, fecha DATE)
CLUSTER BY AUTO;
The requirements are the fine print that matters:
- DBR 15.4 LTS+.
- Delta tables managed by Unity Catalog (UC, Databricks’ governance catalog; see Tips #3).
- Predictive Optimization enabled.
- It runs asynchronously: key adjustment isn’t instant, it settles over time.
WarningAUTO is Databricks-only
CLUSTER BY AUTO doesn’t exist in open-source Delta Lake. Outside Databricks you always specify the columns by hand.
6. Predictive Optimization: the maintenance that runs itself
Running OPTIMIZE, VACUUM and ANALYZE by hand is the boring part of owning Delta tables. Predictive Optimization (PO) does it for you on Unity Catalog managed tables: Databricks identifies the tables that would benefit from maintenance and queues them, instead of running everything on a fixed schedule.
What it runs. OPTIMIZE (including the incremental clustering of Liquid tables), VACUUM (removes files the table no longer references, per its retention) and ANALYZE (collects statistics for the planner). A detail that plays in Liquid’s favor: when PO runs OPTIMIZE, it does not execute ZORDER. On a table with Z-order, PO ignores the already-ordered files; the rest of the maintenance (VACUUM, ANALYZE, compaction) keeps running, but the Z ordering doesn’t maintain itself.
How to enable it. It’s a property inherited in cascade: account → catalog → schema → table. Every managed table takes the account value unless you override it lower down.
ALTER CATALOG mi_catalogo ENABLE PREDICTIVE OPTIMIZATION;
ALTER SCHEMA mi_catalogo.ventas DISABLE PREDICTIVE OPTIMIZATION;
ALTER TABLE mi_catalogo.ventas.hechos INHERIT PREDICTIVE OPTIMIZATION;
INHERIT goes back to the parent object’s value. To check whether it’s active on a table use DESCRIBE TABLE EXTENDED mi_tabla, where the Predictive Optimization field tells you whether it’s ENABLE and whether it was inherited. At the account level you turn it on in the account console, under Settings → Feature enablement. It comes enabled by default for accounts created on or after November 11, 2024; for older accounts the rollout is gradual.
Restrictions and requirements. It only applies to Unity Catalog managed tables. External tables and tables loaded as OpenSharing recipients are out. The work runs on serverless jobs compute, you need a workspace on the Premium plan in a supported region, and it’s billed as a serverless jobs SKU.
TipPO + Liquid: don’t pay for the work twice
If you have Liquid Clustering and Predictive Optimization on, PO runs the OPTIMIZE for your clustered tables. Turn off any scheduled OPTIMIZE jobs so you don’t pay for the work twice. And remember that CLUSTER BY AUTO depends on PO: without PO it can’t pick keys or recluster. Also, PO changes keys only when the predicted savings from better data skipping outweigh the reclustering cost.
7. Migrating from Z-ORDER and from partitioning
- From Z-ORDER: use your
ZORDER BYcolumns directly as clustering keys. It’s practically a one-to-one replacement. - From partitioning: the partition columns become the clustering keys. How depends on the runtime:
- DBR 18.1+: in-place conversion with
ALTER TABLE ventas REPLACE PARTITIONED BY WITH CLUSTER BY (cliente, fecha)(or... WITH CLUSTER BY AUTO). - Earlier runtimes: you have to recreate the table with a
CREATE TABLE ... AS SELECT(CTAS, meaning “create table from a SELECT”) that includes theCLUSTER BY.
- DBR 18.1+: in-place conversion with
ImportantNo mixing: partitions or clustering
Liquid Clustering does not combine with partitioning or Z-ORDER. It’s one or the other: when you migrate, you stop partitioning and stop running ZORDER.
8. Lab: CLUSTER BY vs Z-ORDER vs partitioning, measuring file pruning
The goal is to measure how many files the engine skips under each strategy for the same filtered query. We reuse the synthetic dataset pattern from the Photon lab (#12):
# 1. Synthetic dataset with realistic skew (same base, three tables)
from pyspark.sql import functions as F

base = (spark.range(0, 200_000_000)
        .withColumn("cliente", (F.rand() * 50_000).cast("int"))
        .withColumn("fecha", F.expr("date_add('2024-01-01', cast(rand()*600 as int))"))
        .withColumn("monto", (F.rand() * 1000)))

base.write.mode("overwrite").saveAsTable("lab.ventas_base")
-- 2. Three versions of the table
-- (a) Partitioned by fecha
CREATE TABLE lab.ventas_part
PARTITIONED BY (fecha) AS SELECT * FROM lab.ventas_base;
-- (b) Z-ORDER by cliente, fecha
CREATE TABLE lab.ventas_zorder AS SELECT * FROM lab.ventas_base;
OPTIMIZE lab.ventas_zorder ZORDER BY (cliente, fecha);
-- (c) Liquid Clustering by cliente, fecha
CREATE TABLE lab.ventas_liquid
CLUSTER BY (cliente, fecha) AS SELECT * FROM lab.ventas_base;
OPTIMIZE lab.ventas_liquid FULL;-- 3. The same filtered query on all three, measuring files read
SELECT count(*) FROM lab.ventas_liquid
WHERE cliente = 4242 AND fecha BETWEEN '2024-06-01' AND '2024-06-30';To read how many files each one skipped, check the query profile (the files pruned / files read metrics) or DESCRIBE DETAIL table for the file count.
9. Results: reads
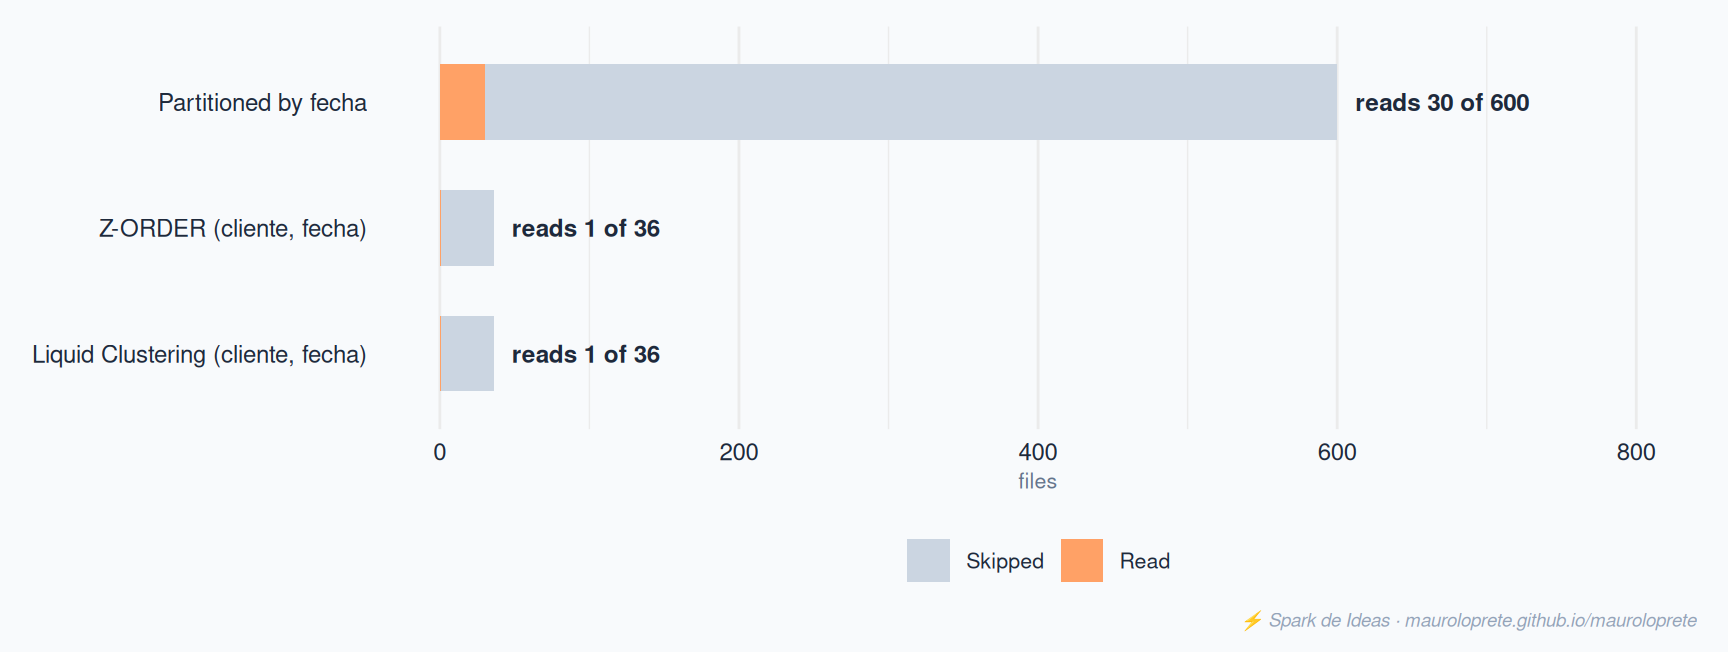
Measured on 200 million rows on serverless with Photon, with the same query filtering by cliente and fecha. Files read and skipped come from the query history (read_files_count / pruned_files_count); total files, from DESCRIBE DETAIL. Skipped: the files data skipping avoided reading (the query profile calls the metric Files pruned).
| Strategy | Total files | Files read | Files skipped | Bytes read | Scan time |
|---|---|---|---|---|---|
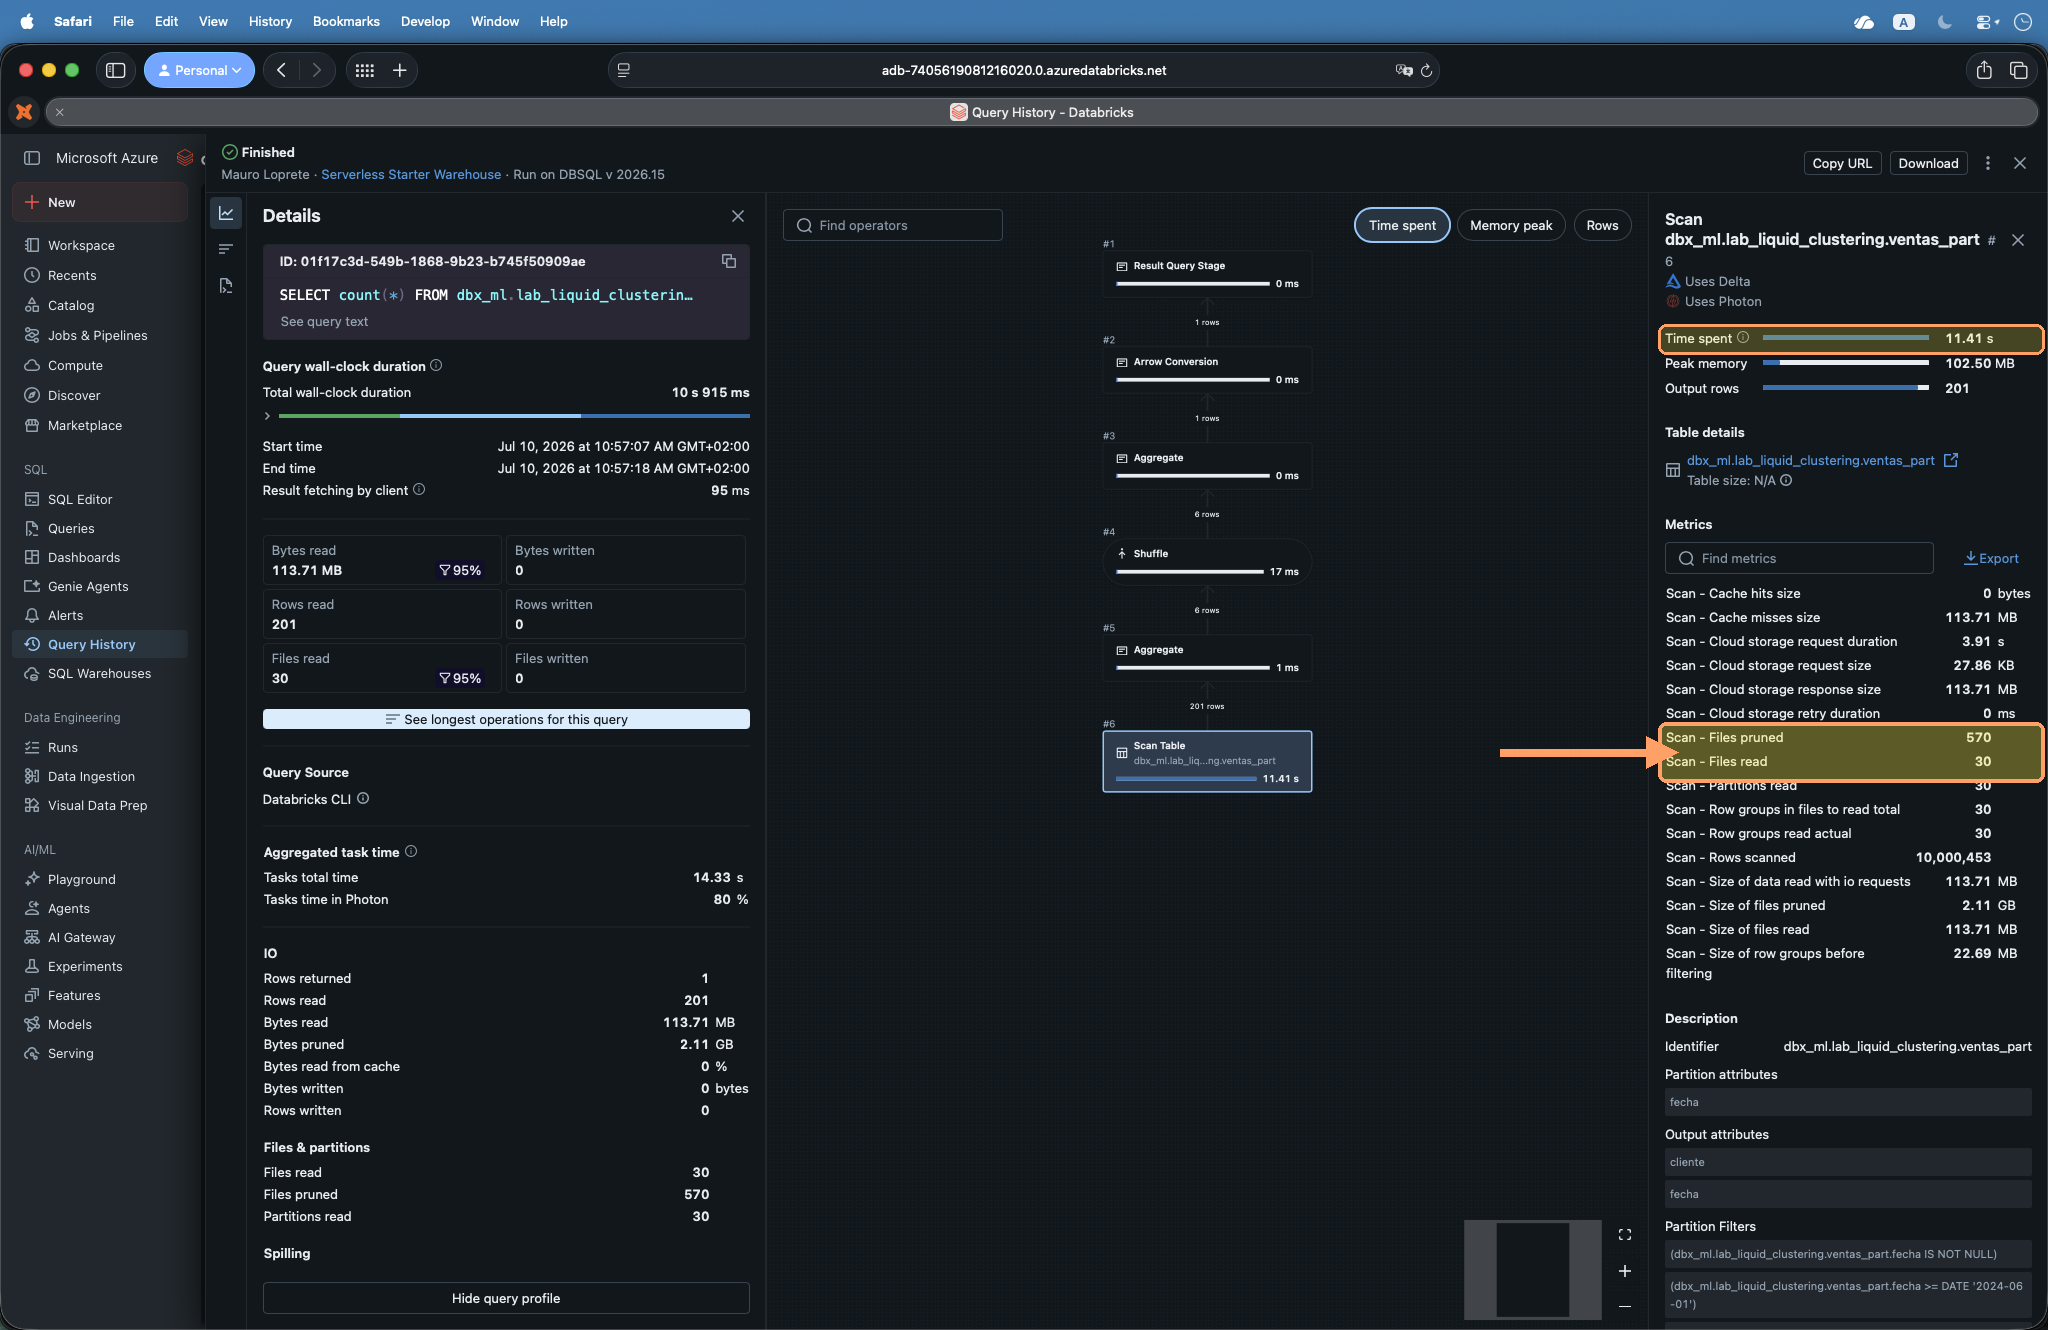
| Partitioned by fecha | 600 | 30 | 570 | 119 MB | 11.41 s |
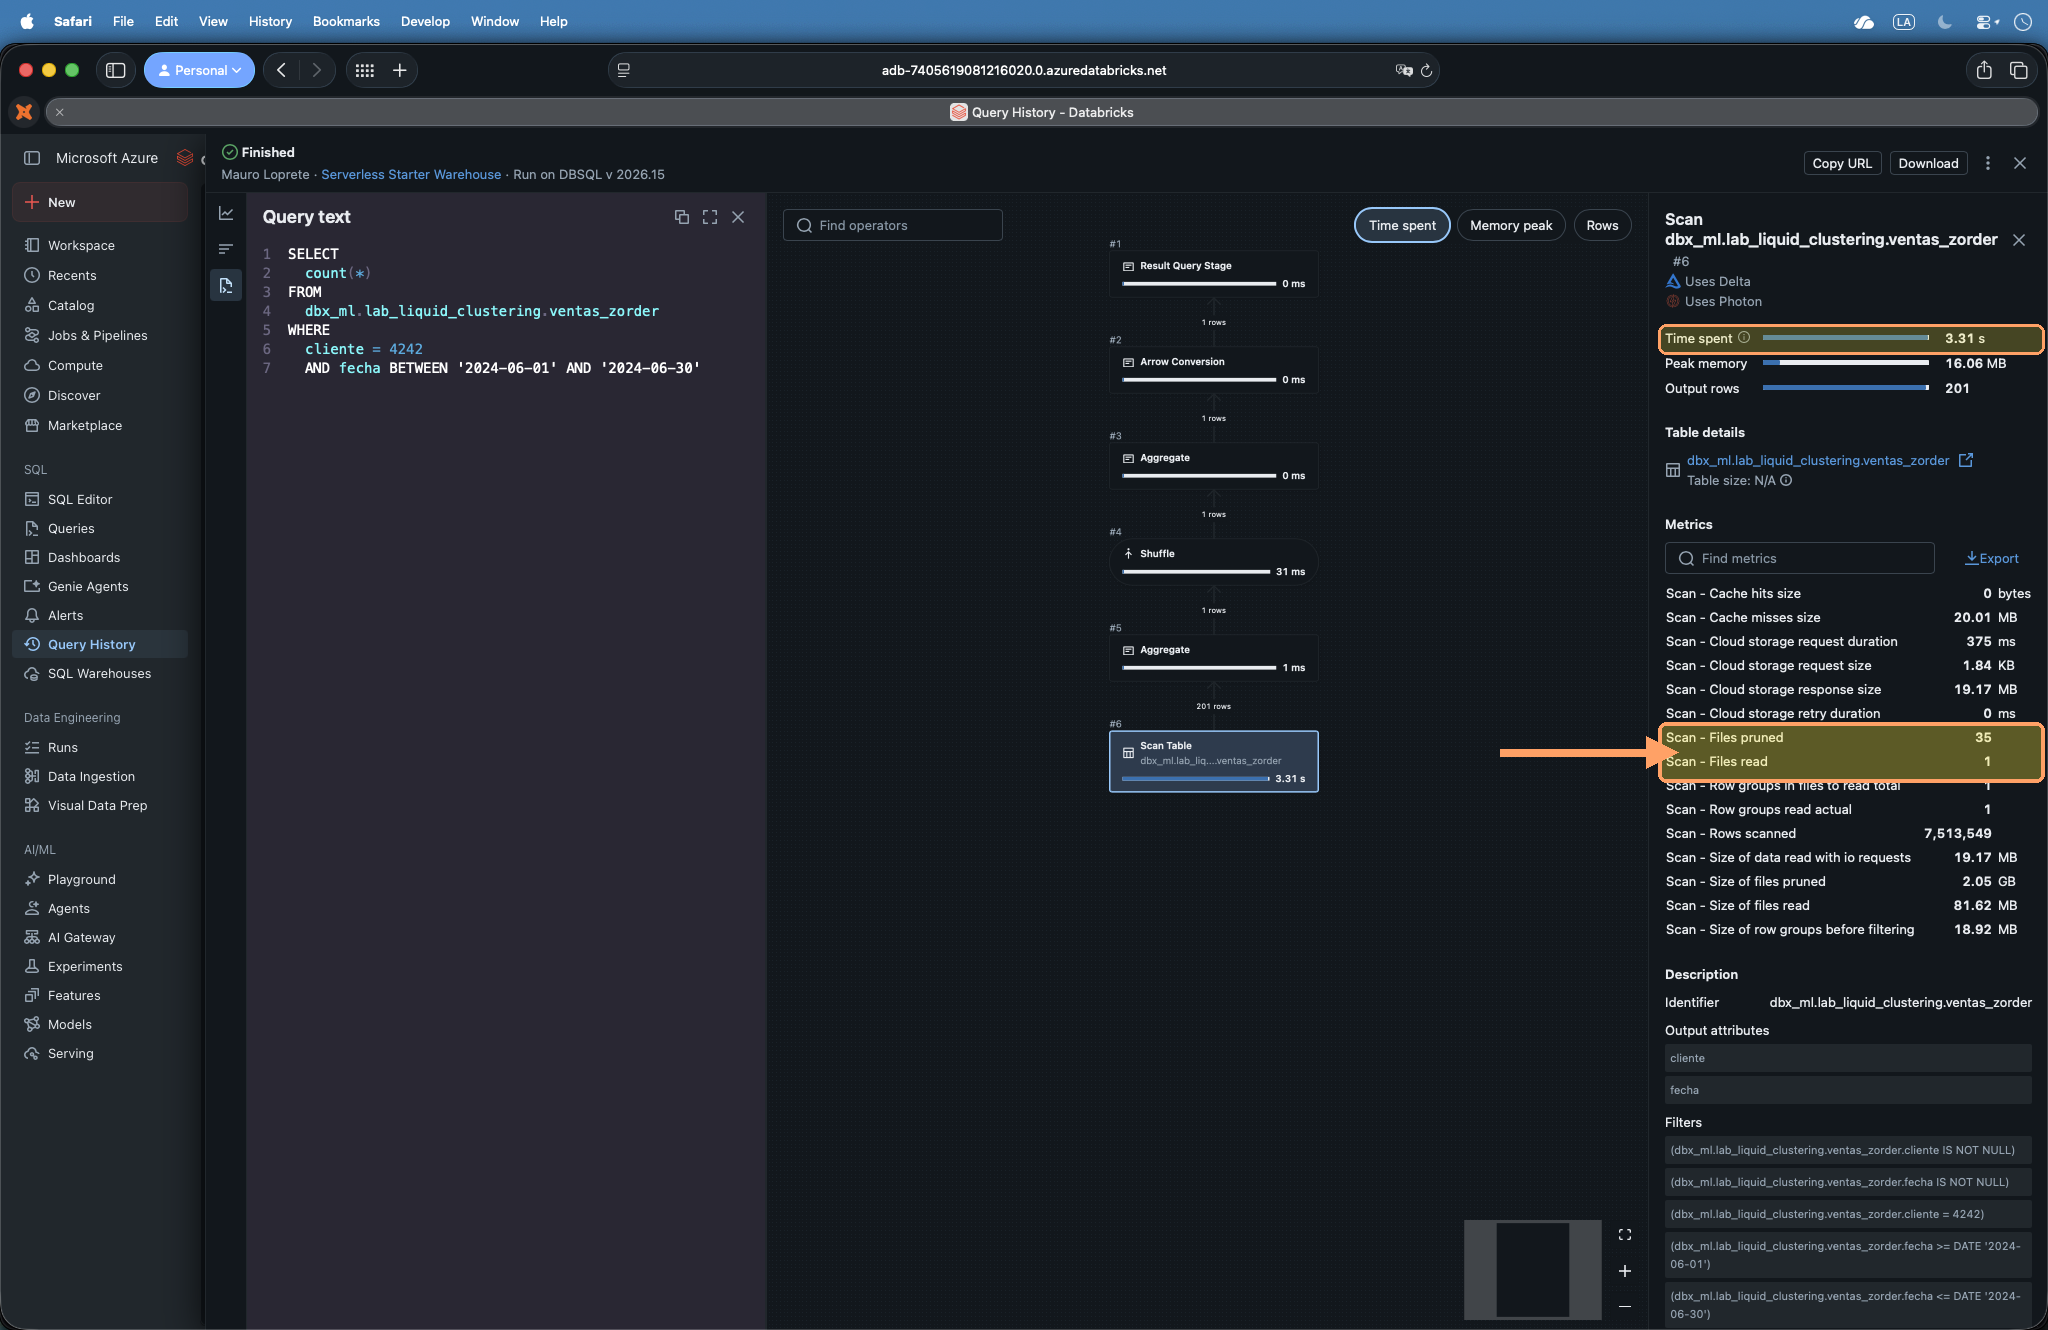
| Z-ORDER (cliente, fecha) | 36 | 1 | 35 | 20 MB | 3.31 s (3.4x faster) |
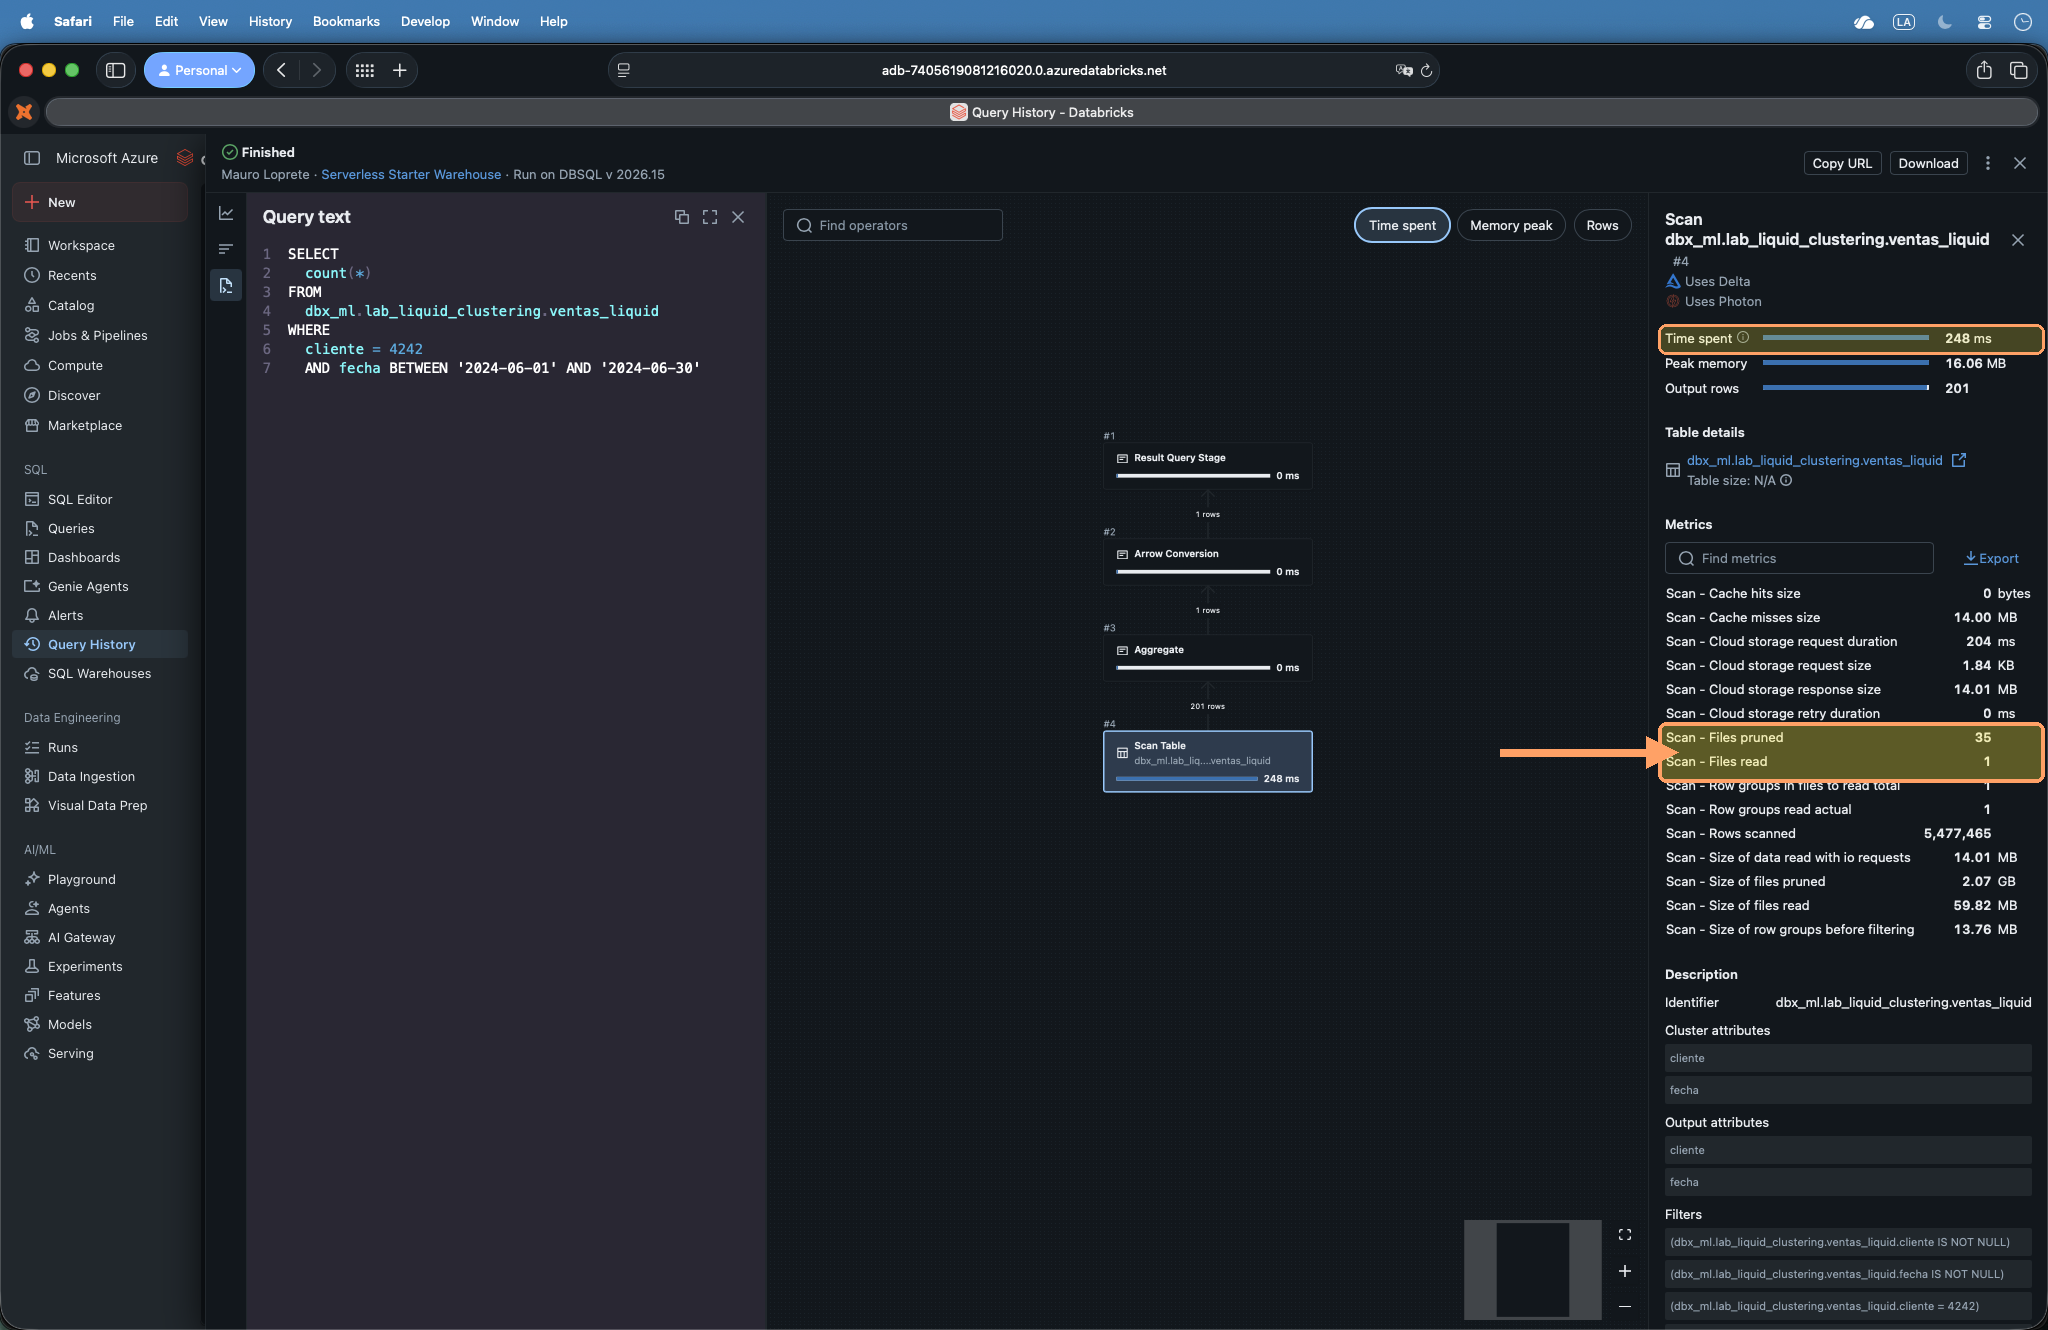
| Liquid Clustering (cliente, fecha) | 36 | 1 | 35 | 15 MB | 248 ms (46x faster) |
Two takeaways. First, partitioning by fecha exploded the layout into 600 files (one per day), the classic small-files problem; clustering left 36. Second, the query does skip files by fecha on the partitioned table (from 600 down to 30, the days of June), but since it can’t skip by cliente it reads them whole: 30 files and 119 MB. Z-ORDER and Liquid skip by both columns and drop to 1 file; Liquid also reads fewer bytes (15 vs 20 MB) because it packs better with the Hilbert curve.
NoteThe statistician doesn’t settle for one run
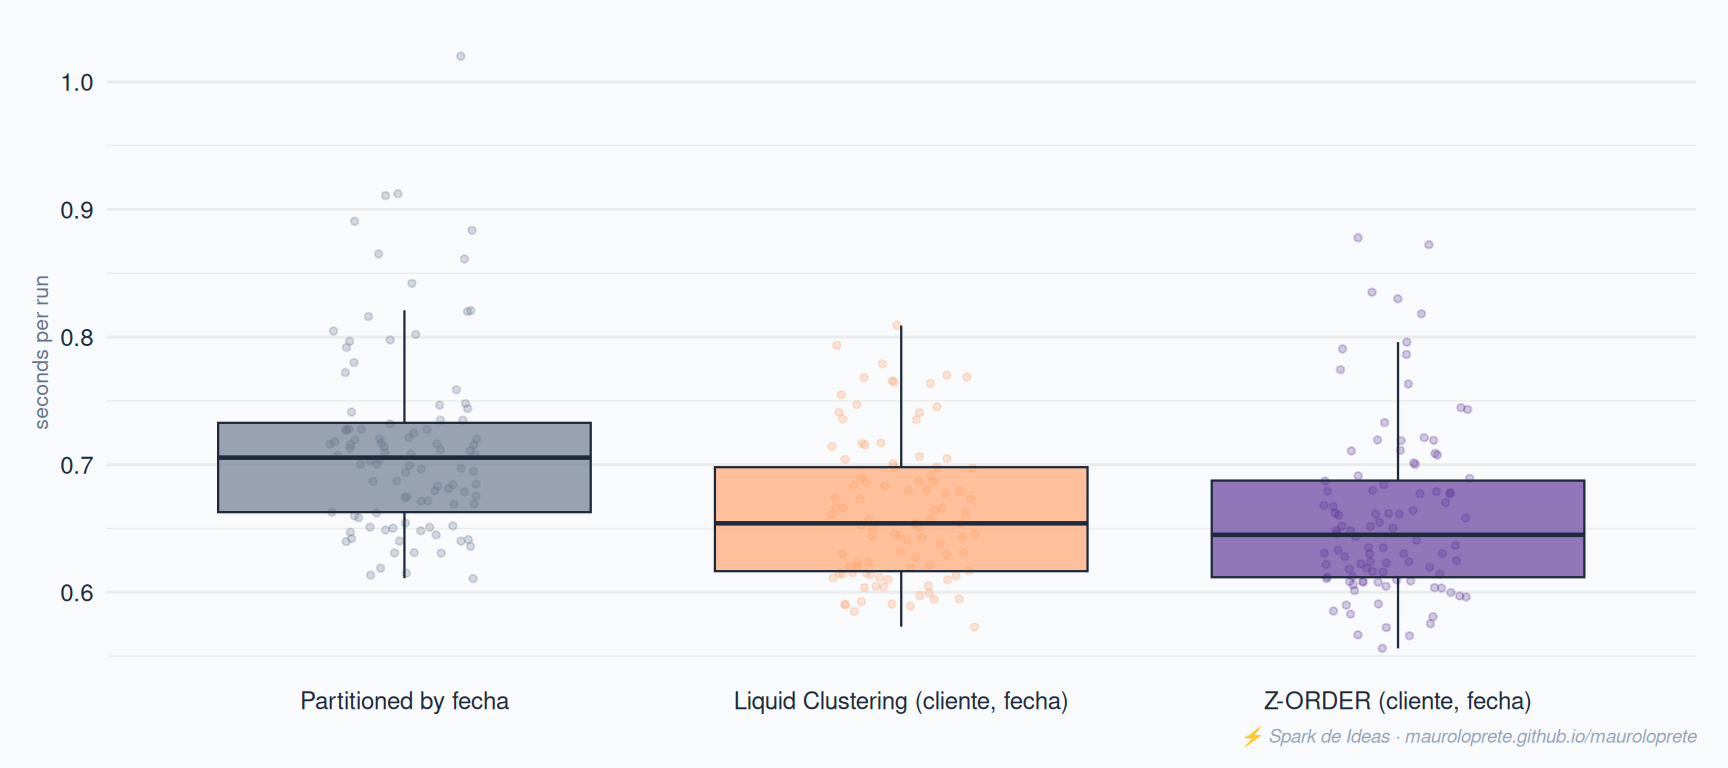
Confession: I’m a statistician, and a single run doesn’t let me sleep. A measurement without a distribution is an anecdote. So I ran the same query 100 times per strategy, interleaved (partitioned, Z-ORDER, Liquid, and around again) so the cache and cluster state affect all three equally:
| Strategy | Median | p25–p75 | Min | Max |
|---|---|---|---|---|
| Partitioned by fecha | 0.705 s | 0.662–0.734 s | 0.611 s | 1.02 s |
| Z-ORDER (cliente, fecha) | 0.645 s | 0.611–0.688 s | 0.556 s | 0.878 s |
| Liquid Clustering (cliente, fecha) | 0.654 s | 0.615–0.698 s | 0.573 s | 0.809 s |
The honest reading: with a warm cache, all three converge. Z-ORDER and Liquid tie (9 ms of median difference, well within noise) and partitioning ends up ~8% slower, consistent with reading 30 files instead of 1. The layout doesn’t speed up what’s already in memory: it pays off on the first read (the cold scan in the table above), on the bytes moved and on maintenance. Double takeaway: measure with a distribution, and know which part of the time you’re measuring.
10. Results: writes
So far, all reads. The other side matters just as much: a new batch lands (10 million rows, 5% of the table) and you have to write it and then maintain each strategy’s ordering:
# The new batch: 10M rows with the same distribution.
# It gets generated ONCE and the same batch is inserted into all
# three tables, so the comparison is fair.
lote = (spark.range(0, 10_000_000)
        .withColumn("cliente", (F.rand() * 50_000).cast("int"))
        .withColumn("fecha", F.expr("date_add('2024-01-01', cast(rand()*600 as int))"))
        .withColumn("monto", (F.rand() * 1000)))

lote.write.saveAsTable("lab.ventas_lote")
-- The same append on all three tables
INSERT INTO lab.ventas_part SELECT * FROM lab.ventas_lote;
INSERT INTO lab.ventas_zorder SELECT * FROM lab.ventas_lote;
INSERT INTO lab.ventas_liquid SELECT * FROM lab.ventas_lote;
-- The maintenance that follows for each strategy
OPTIMIZE lab.ventas_part; -- compacts the partitions
OPTIMIZE lab.ventas_zorder ZORDER BY (cliente, fecha); -- re-sorts (not incremental)
OPTIMIZE lab.ventas_liquid; -- incrementalEvery operation leaves its metrics in the table history: files created by the append, files and MB rewritten by the maintenance.
-- numFiles and numOutputBytes from the INSERT; numRemovedFiles,
-- numAddedFiles and numRemovedBytes from the OPTIMIZE
DESCRIBE HISTORY lab.ventas_liquid LIMIT 2;
This is how it went:
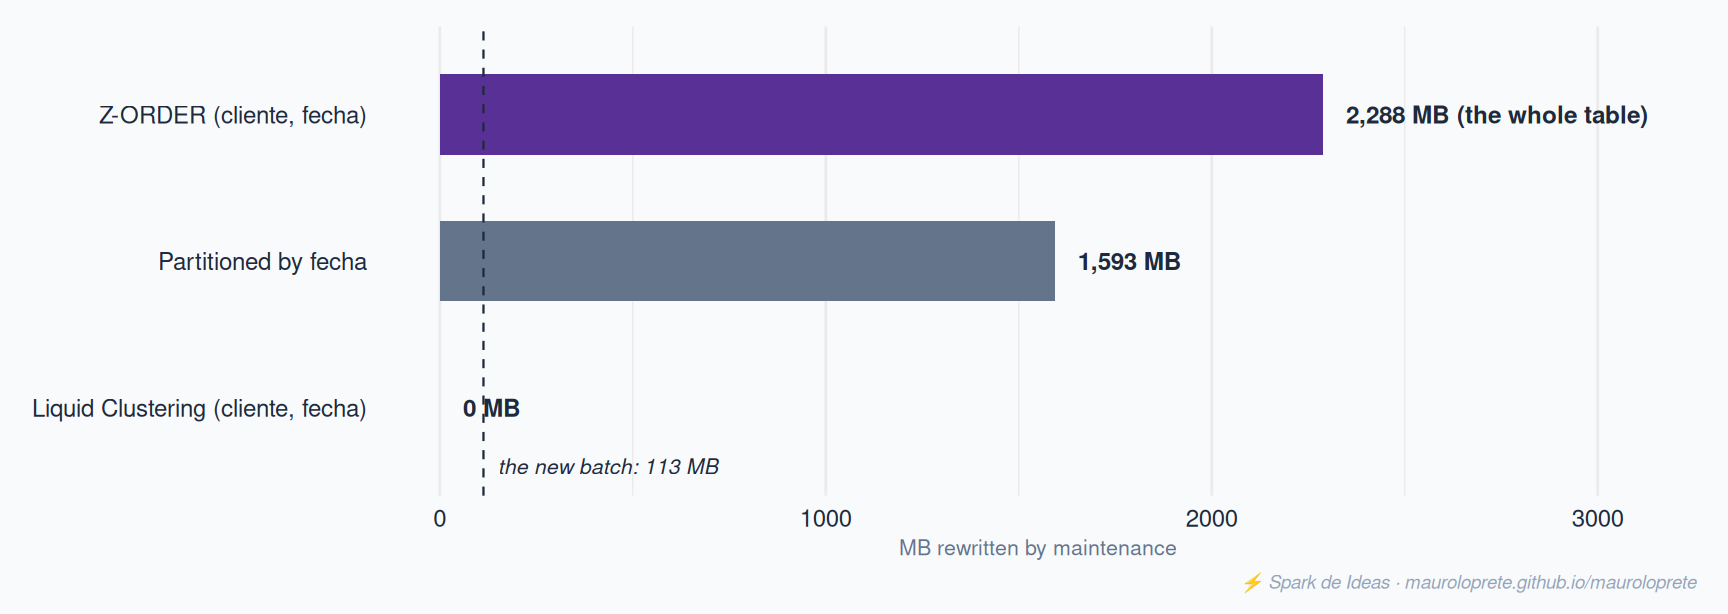
| Strategy | Batch append | Files created | Maintenance | MB rewritten |
|---|---|---|---|---|
| Partitioned by fecha | 18.5 s | 600 | OPTIMIZE · 40.8 s |
1,593 MB |
| Z-ORDER (cliente, fecha) | 2.5 s | 2 | OPTIMIZE ZORDER · 29.3 s |
2,288 MB (the whole table) |
| Liquid Clustering (cliente, fecha) | 1.9 s | 2 | OPTIMIZE · 4.8 s |
0 MB |
Three stories in one table:
- Partitioning fragments the append: the same batch gets split into 600 tiny files (one folder per fecha), takes almost 10 times longer to write, and the follow-up compaction rewrites 1.6 GB.
- Z-ORDER writes fast, but keeping the ordering costs the whole table: to absorb 113 MB of new data,
OPTIMIZE ZORDERrewrote 2.3 GB. That’s the write amplification from the section 4 diagram, now measured. - Liquid writes fast and keeping the ordering cost nothing: the incremental
OPTIMIZEfinished in 4.8 seconds without rewriting a single file (0 files, 0 MB).
TipThe index analogy
If you come from relational databases, this will sound familiar. Liquid Clustering behaves like a good index: it speeds up reads without punishing writes. Z-ORDER is also a read “index”, but with the classic expensive-index problem: every write makes you pay for its maintenance, which here means rewriting the entire table. And partitioning is an index that also forces you to pick the column once and forever.
TipReproduce it yourself
The full experiment is available as a Databricks Asset Bundle at spark-de-ideas-labs/tips/liquid-clustering, and it runs on Free Edition:
databricks bundle deploy
databricks bundle run liquid_clustering_benchmark
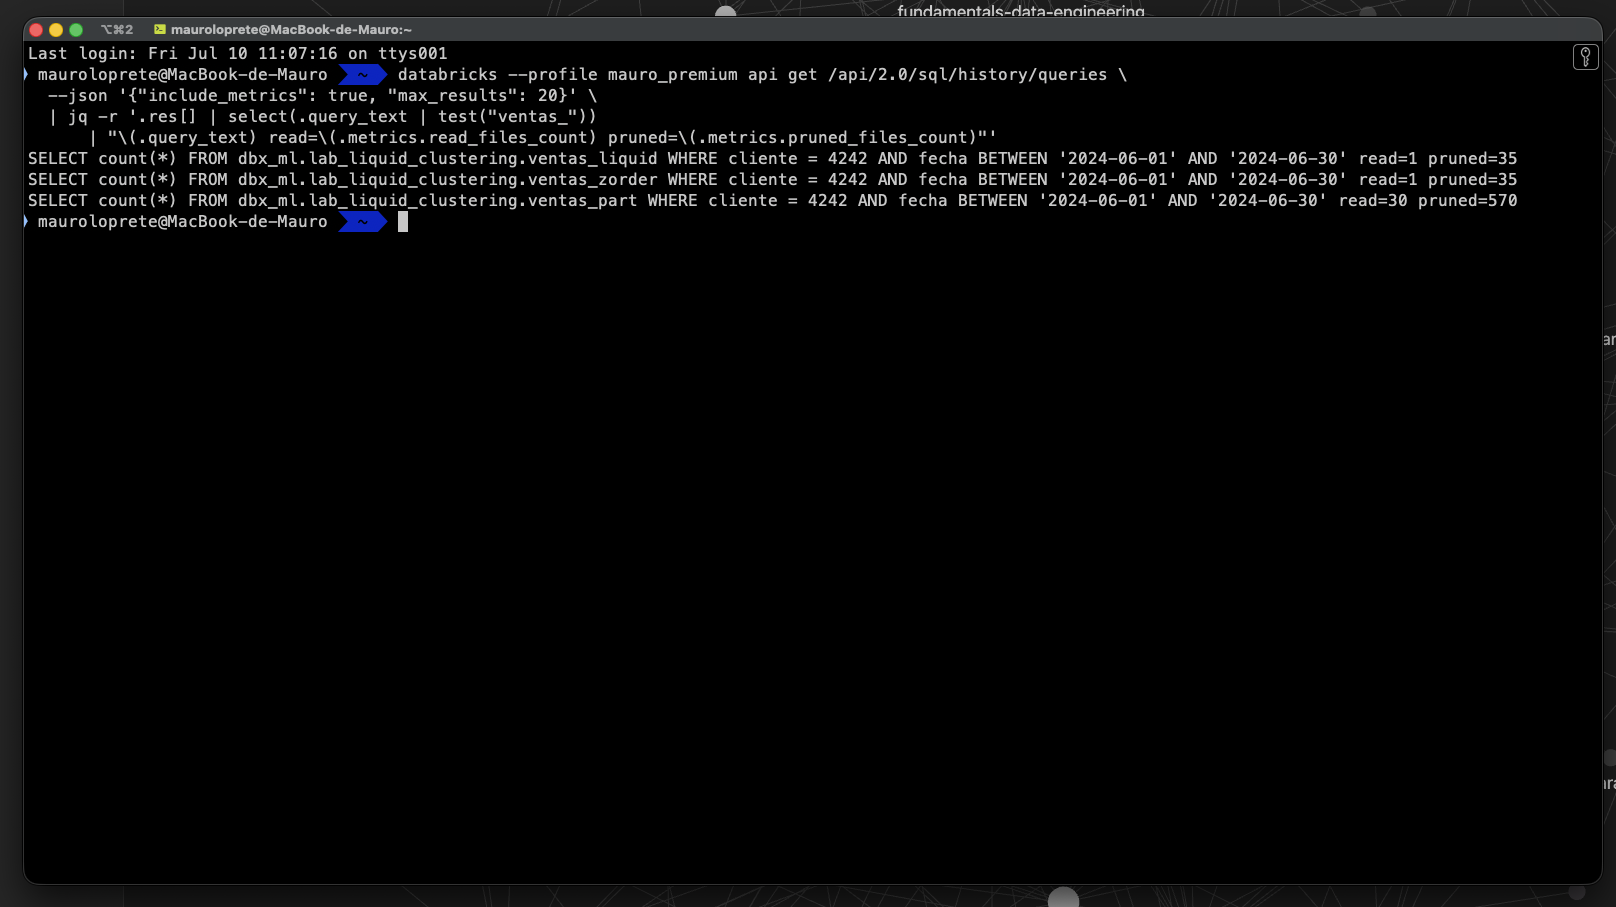
The notebook reports the total file count (DESCRIBE DETAIL), wall-clock, the repeated runs (timings_raw, adjustable with --var bench_runs=N) and the write metrics (append + maintenance). Files read and skipped can’t be read from the plan programmatically on serverless (Spark Connect). In the UI they are there: even in a serverless notebook you can open the query profile from the See performance link. To get them programmatically, I measured by running the queries on a SQL Warehouse and reading the query history:
databricks api get /api/2.0/sql/history/queries \
  --json '{"include_metrics": true, "max_results": 20}' \
  | jq -r '.res[] | select(.query_text | test("ventas_"))
      | "\(.query_text) read=\(.metrics.read_files_count) pruned=\(.metrics.pruned_files_count)"'
This is the actual output of that command, with all three layouts measured:
The same pair of numbers lives in each query’s query profile. To see it: open the query in Query History, enter the query profile and select the Scan node. In the metrics panel on the right you’ll find the Files pruned and Files read rows (highlighted in yellow in the screenshots), and above them the scan’s Time spent, which shows the layout’s direct effect:
11. Requirements, compatibility and protocol
- Availability: GA for Delta with DBR 15.4 LTS+; Public Preview for Apache Iceberg with DBR 16.4 LTS+; in open-source Delta since 3.1.0.
- Table protocol: it uses writer version 7 / reader version 3, and it can’t be downgraded. In practice: old Delta clients that don’t support those protocols won’t be able to read the table.
- Incompatibilities: it doesn’t combine with partitioning or Z-ORDER.
- DataFrame API (Python/Scala): keys can only be set when creating the table or in
overwritemode (CREATE OR REPLACE), never onappend. To change them while appending, useALTER TABLEvia SQL. - Materialized views and streaming tables: keys aren’t changed with
ALTER TABLE; you adjust the pipeline/view definition.
12. Gotchas
- Enabling ≠ reclustering. Setting
CLUSTER BYdoesn’t reorder history. The first time, runOPTIMIZE FULLor you’ll see little improvement and conclude it “doesn’t work”. AUTOis Databricks-only. It requires Unity Catalog + Predictive Optimization. In open-source Delta it doesn’t exist: you always specify columns.- More keys isn’t better. On tables <10 TB, 4 keys can perform worse than 2 when filtering by a single column. Start with the columns you actually filter by.
- Column 33 doesn’t cluster. Only columns with statistics (first 32 by default) work as keys. If your column falls beyond that, adjust the statistics config first.
- With partitions it’s not that you shouldn’t: you can’t. It’s a hard incompatibility: a table is either partitioned or clustered, never both, and
ALTER TABLE ... CLUSTER BYfails on a partitioned table. If you’re coming from one, migrate for real (section 7). - The protocol doesn’t go back down. Writer v7 / reader v3 is one-way: check that all your readers (connectors, external tools) support it before migrating shared tables.
13. When to use Liquid Clustering (and when not to)
Databricks recommends Liquid Clustering for all new tables. The cases that benefit most: filters on high-cardinality columns, tables with heavy skew (badly unbalanced values), fast growth, concurrent writes and access patterns that change over time.
| Situation | Liquid Clustering? | Why |
|---|---|---|
| New table, any size | Yes | It’s Databricks’ default recommendation |
| You filter by a high-cardinality column | Yes | Where partitioning suffered, this shines |
| You already use Z-ORDER | Yes, migrate | Almost a one-to-one replacement, and incremental on top |
| Readers with old Delta clients | Careful | v7/v3 protocol not downgradable: they may not be able to read it |
You need AUTO but you’re on open-source Delta |
No (AUTO) | AUTO is Databricks-only; use manual keys |
| Small table always filtered by a single column | With 1-2 keys | 4 keys can make data skipping worse |
References
- Use liquid clustering for tables — Azure Databricks
- Use liquid clustering for tables — Databricks on AWS
- CLUSTER BY clause (TABLE) — SQL reference
- Use liquid clustering for Delta tables — Delta Lake open-source
- Delta Lake 3.1.0 release: Liquid Clustering with Hilbert curve and ZCubes
- Predictive optimization for Unity Catalog managed tables
Other posts in the series
If this post was useful, check out the previous Databricks Tips:
- Tips #1: Databricks Asset Bundles — IaC for Databricks
- Tips #2: Delta Lake — the 7 things you wish you’d known
- Tips #3: Unity Catalog — governance nobody implements well
- Tips #4: Structured Streaming — watermarks, triggers and micro-batch
- Tips #5: MLflow + Unity Catalog — from experiment to model
- Tips #6: Feature Engineering — features that survive production
- Tips #7: Docker on Databricks — custom containers
- Tips #8: Jobs & Workflows — streaming and event-driven triggers
- Tips #9: SQL Warehouses — the compute that turns itself on
- Tips #10: AI Gateway — centralized governance for LLMs
- Tips #11: Lakeflow Declarative Pipelines — declarative pipelines with built-in quality
- Tips #12: Photon — the C++ engine that speeds up your queries
- Tips #13: OpenSharing — sharing without copying
Next in the series: Query Federation, or how to query that Postgres nobody wants to migrate without moving a single byte.