Genie ZeroOps: Databricks wants your pipelines to fix themselves
Data Engineering
Databricks Tips
MLOps
Detect, Assess, Remediate, Verify — how the Databricks agent that monitors, diagnoses, and proposes fixes for your production pipelines works.
You have 47 pipelines in production. One of them stopped writing rows 3 days ago, but since it doesn’t throw an exception nobody noticed — until a revenue dashboard shows zero and the CFO drops a message in the Slack channel. You start tracing: the output table is empty, the pipeline ran OK, the logs say nothing. Two hours later you discover that someone changed a schema three tables upstream and your SELECT * brought columns back in a different order. You fix it, test it by hand, push it. And you know that tomorrow it can happen again with any of the other 46.
At the Data + AI Summit 2026, Databricks introduced Genie ZeroOps: an AI agent that runs in the background, monitors your production workloads, diagnoses the root cause using Unity Catalog lineage, generates the fix, tests it in an isolated sandbox, and presents it to you for approval.
Is this the end of data on-call? Let’s see.
NoteTL;DR
- Genie ZeroOps is a background AI agent that monitors jobs, pipelines, tables, and ML models.
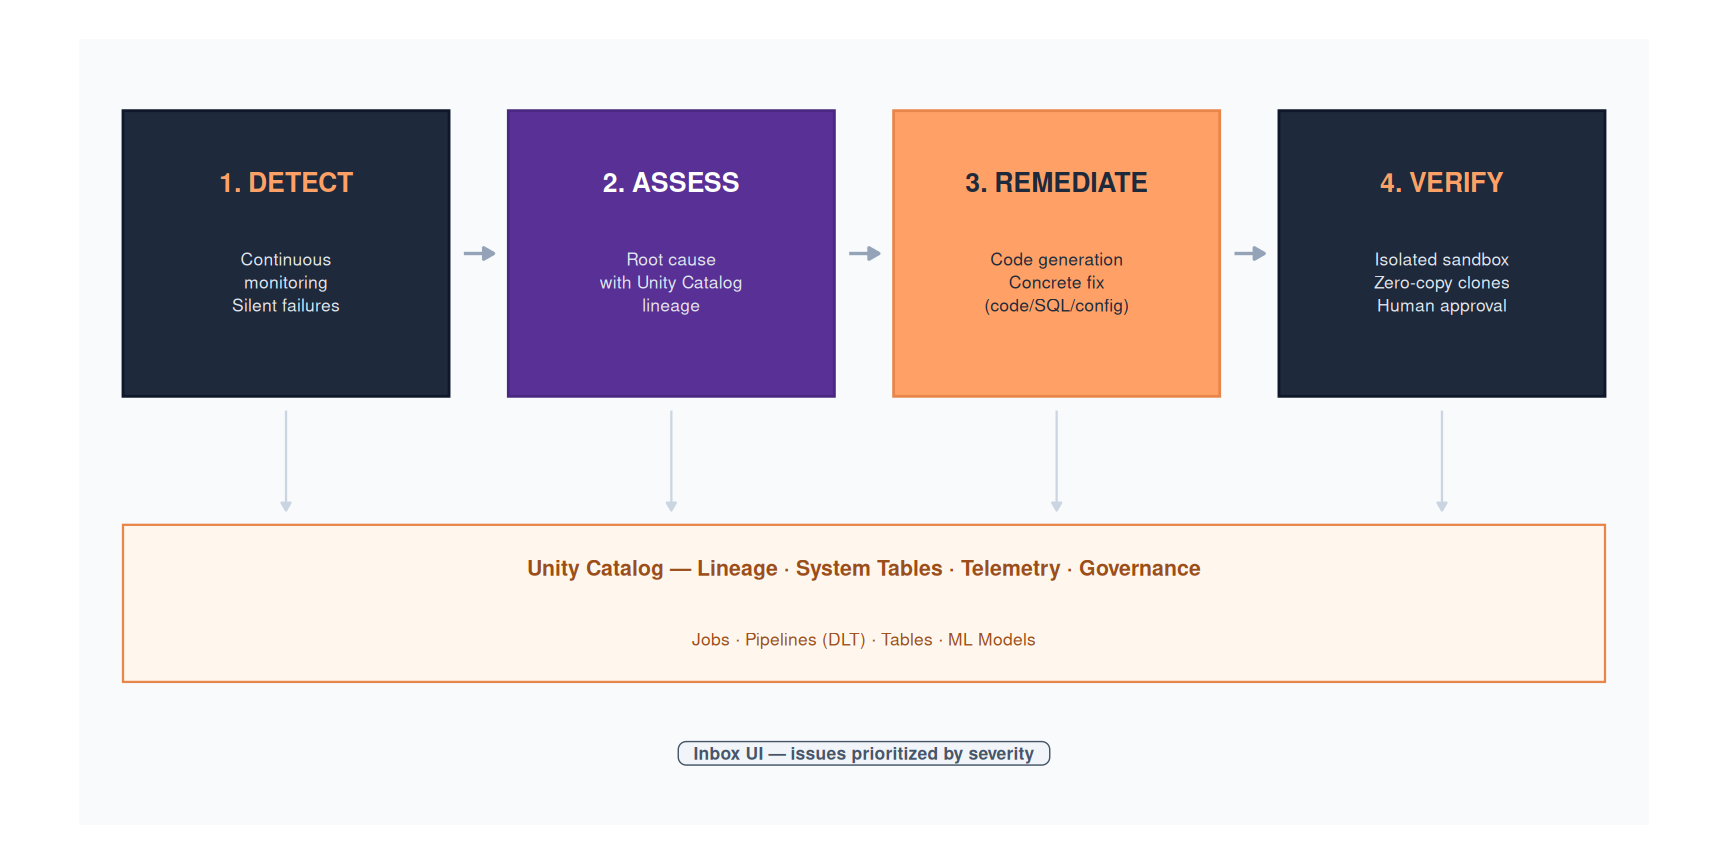
- It works in 4 steps: Detect → Assess (root cause with lineage) → Remediate (generates the fix) → Verify (isolated sandbox with zero-copy clones).
- It doesn’t apply changes without human approval — the agent proposes, you decide.
- It’s part of Genie One (the family) and Lakeflow (the data engineering platform).
- It’s in Private Preview. Supports Jobs, DLT Pipelines, Tables, ML models. Roadmap: Apps, Lakebase.
- We haven’t been able to try it yet — everything we cover comes from official docs and DAIS 2026 sessions.
The problem: building is faster than maintaining
With AI coding tools, creating pipelines gets faster and faster. An engineer who used to take a week to put together an ingestion pipeline now does it in a day with Genie Code. But maintenance doesn’t scale the same way: every new pipeline you put in production is one more pipeline that can break, degrade, or silently go stale.
The result: most data teams spend more time putting out fires than building new things.
| Build | Maintain | |
|---|---|---|
| Trend | Faster and faster (AI coding, IaC, declarative) | Grows linearly with the number of assets |
| Who does it | Engineers, with AI help | The same engineers, without help |
| Impact | More assets in production | More on-call, more incidents, more fatigue |
It’s like building houses faster and faster without hiring more plumbers. At some point, everything starts breaking.
What ZeroOps is (the concept)
ZeroOps isn’t a product — it’s a philosophy: zero manual intervention in the steady state of your data pipelines. It doesn’t mean nobody operates. It means the system operates itself: you design the rules, the platform executes them.
| Concept | Automates… | Example |
|---|---|---|
| DevOps | The deploy | CI/CD, IaC, containers |
| DataOps | The data lifecycle | Testing, quality gates, observability |
| ZeroOps | The operation | Detect → diagnose → fix → verify, no humans |
In previous posts we covered the DataOps pieces: DABs for IaC, serverless SQL Warehouses, Lakeflow DLT for declarative pipelines, Jobs with event-driven triggers, and DataOps as a practice. ZeroOps is the missing layer: the one that closes the loop when something breaks.
The acid test: can you go on vacation for 2 weeks without getting a call about a pipeline? If not, you don’t have ZeroOps.
Where ZeroOps fits in Databricks
Before diving into the product, let’s place the pieces:
Genie One is Databricks’ family of AI agents:
| Agent | Function | Analogy |
|---|---|---|
| Genie Code | Development — helps you write pipelines, SQL, notebooks | Your copilot |
| Genie Spaces | Analysis — answers business questions about your data | Your analyst |
| Genie ZeroOps | Operations — monitors and fixes pipelines in production | Your automated SRE |
Lakeflow is the unified data engineering platform:
- Connect: ingestion with 100+ native connectors
- Pipelines: declarative transformations (formerly DLT)
- Designer: visual no-code building
- ZeroOps: automated operations
Genie Code helps you build. Genie ZeroOps operates what you built. They’re complementary.
How Genie ZeroOps works
The agent operates in 4 steps. Each step uses a native platform component — it’s not an external tool that connects via API.
Step 1: Detect — continuous monitoring
The agent runs in the background and monitors jobs, DLT pipelines, tables, and ML models. But the interesting part isn’t that it detects errors — any alert already does that. The interesting part is that it detects silent failures: problems that don’t throw an exception but degrade your data.
What it detects:
| Type | Example |
|---|---|
| Explicit error | Job failed with SchemaEvolutionException |
| Silent failure | Pipeline completed OK but the table has 0 rows |
| Data quality | A DLT expectation started failing on 15% of rows |
| Schema drift | A field changed from INT to STRING three tables upstream |
| Late-arriving data | The table hasn’t been updated in the last 4 hours |
| ML model drift | The model’s predictions started degrading |
It uses the platform’s native telemetry (system tables, DLT event logs, data quality metrics) and doesn’t need you to configure anything external. It’s there because it lives inside Databricks.
TipSilent failures: the real enemy
Most monitoring tools warn you when something fails. Few warn you when something looks like it’s working but the data is wrong. A pipeline that completes with 0 rows and no error is technically successful — but your dashboard ends up empty. ZeroOps aims at detecting exactly that.
Step 2: Assess — root cause with lineage
Here’s where it gets interesting. When ZeroOps detects a problem, it doesn’t just tell you “job X failed” and call it a day. It uses the Unity Catalog dependency graph to trace the root cause through the entire chain.
Is the error in your pipeline? Or is it a schema change someone made three tables upstream? Or invalid data another team introduced into a shared table?
ZeroOps correlates:
- Execution logs of the failed job
- Unity Catalog lineage (table → table → table back to the source)
- Data quality metrics (expectations, null rates, row counts)
- Workload context (when the last successful run was, what changed since then)
This is what a senior engineer with experience on your platform would do — but in seconds, not hours.
ImportantNative lineage is the key differentiator
Tools like Monte Carlo, Datadog, or PagerDuty do pieces of this. But they connect via API, see partial metadata, and don’t have access to the full dependency graph. ZeroOps has native access to all of Unity Catalog’s lineage — every table, every column, every transformation. That’s what lets it trace an error back to the source with no additional configuration.
In the DAIS session on Data Quality, they showed a concrete case: a broken revenue dashboard. ZeroOps traced the cause to a schema change in an upstream table and proposed the fix in minutes.
Step 3: Remediate — generates the fix
Once it has identified the root cause, ZeroOps generates the concrete fix using agentic code generation. It’s not a vague suggestion — it’s code (SQL, Python, config) you can review and apply.
What makes this code generation different:
- It’s informed by lineage: it knows which tables depend on which, which fields are used downstream
- It knows your development workflow: GitHub PRs, Jira tickets (when integrated)
- It has historical context: it knows when the last successful run was and what changed
For ML models, the flow is even more specific:
- It detects that the model degraded (drift in predictions or in evaluation metrics)
- It builds a corrected candidate model
- It evaluates it with the same evaluation suite you use in production
- It only proposes it if it performs measurably better than the current model
It doesn’t replace your model without asking. It tells you: “I built this candidate, here are the metrics compared against your current model — do you want to deploy it?”
Step 4: Verify — isolated sandbox
This is the step that separates ZeroOps from a script that applies fixes automatically. Nothing gets applied in production without your approval.
The sandbox has 3 layers of safety:
| Layer | What it does |
|---|---|
| Zero-copy shallow clones | Uses your real data without copying it. No duplicated storage, no replicas. |
| Scoped permissions | The agent only accesses what it needs to test the fix. |
| Network isolation | The sandbox is isolated from production — if the fix has a bug, nothing is affected. |
The flow:
- ZeroOps generates the fix
- It runs it in the sandbox against your real data (via shallow clone)
- It compares results: does the fix solve the problem? Does it introduce regressions?
- It presents everything in an inbox-style UI: the issue, the root cause, the proposed fix, and the sandbox results
- You approve, edit, or reject
WarningHuman-in-the-loop: it’s not optional
ZeroOps requires explicit human approval before applying any change in production. This is not a setting you can turn off — it’s part of the design. And it makes sense: an agent that applies fixes automatically without supervision is an agent that can break things silently.
What it supports today and what’s coming
| Workload | Status | What it detects/fixes |
|---|---|---|
| Jobs | Private Preview | Failures, timeouts, resource issues |
| Pipelines (Lakeflow DLT) | Private Preview | Failed expectations, schema drift, CDC issues |
| Tables (Unity Catalog) | Private Preview | Data quality, freshness, schema changes |
| ML Models | Private Preview | Model drift, prediction degradation |
| Apps | Roadmap | TBD |
| Lakebase | Roadmap | TBD |
Availability: Private Preview on AWS, Azure, and GCP — no confirmed GA dates. To get access you have to contact your Databricks account team.
How it connects with everything that came before
If you’ve been following the series, ZeroOps is the link that connects all the pieces:
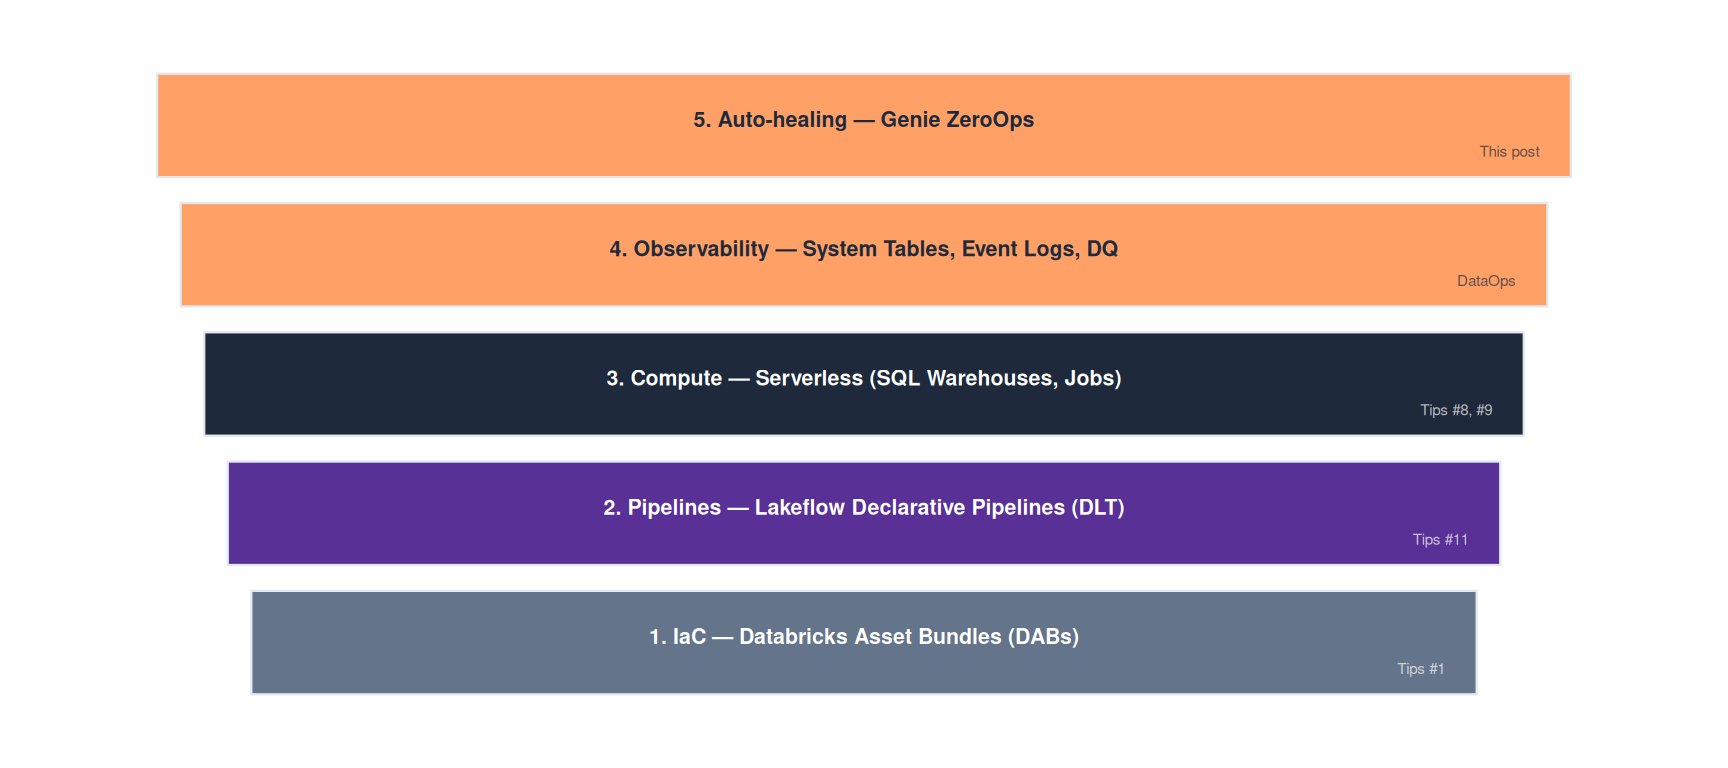
We covered each layer in a post. ZeroOps is the final layer that closes the loop: when something breaks in layers 1-4, layer 5 detects it, diagnoses it, and proposes the fix.
| Layer | Post | What it automates |
|---|---|---|
| IaC | Tips #1: DABs | Resource creation (jobs, pipelines, permissions) |
| Pipelines | Tips #11: Lakeflow DLT | Orchestration, quality gates, CDC |
| Compute | Tips #8 / #9 | Triggers, auto-scaling, serverless |
| Observability | DataOps | Monitoring, alerts, SLAs |
| Auto-healing | This post | Detect → diagnose → fix → verify |
Genie Code vs Genie ZeroOps
This causes confusion because both are “Genie” and both generate code. But they do fundamentally different things:
| Genie Code | Genie ZeroOps | |
|---|---|---|
| When | While you develop | While your pipelines run in prod |
| How | You ask it for help | It detects problems on its own |
| What it generates | New pipelines, queries, notebooks | Fixes for existing pipelines |
| Interaction | Interactive chat (copilot) | Async inbox (prioritized issues) |
| Analogy | Pair programmer | Automated SRE |
They’re complementary: Code helps you build faster, ZeroOps helps keep what you built from breaking.
Gotchas and open questions
Private Preview = subject to change. Everything we cover here is pre-GA. Features, UI, limitations — all of it may be different by the time it goes public.
False positives. What happens if the proposed fix is wrong? The sandbox mitigates the risk, but if the agent floods your inbox with unnecessary fixes, you stop paying attention. Signal/noise will be key.
Skill atrophy. If engineers stop debugging because the agent does it for them, they lose the ability to solve what the agent can’t solve. Metric to monitor: % of fixes approved without edits. If it’s very high, either the agent is perfect (unlikely) or your team stopped reviewing.
The agent’s cost. How much compute does the agent consume running in the background 24/7? No published pricing. For teams on a tight budget, this can be a deal-breaker.
Vendor lock-in. The entire ZeroOps stack (lineage, sandbox, code generation) is 100% Databricks. If your strategy is multi-cloud or multi-vendor, this ties you more tightly to the platform.
Data Mesh. Does the agent respect domain boundaries? If the Marketing team has its pipelines and Finance has theirs, can ZeroOps propose a fix that crosses domains? Or is it limited to the team’s scope?
TipMetrics a CIO should track
If your organization adopts ZeroOps, these are the metrics that matter: MTTD/MTTR (detection and resolution time), % of incidents closed without human intervention, root cause analysis accuracy, false positive rate of proposed fixes, cost per incident net of the agent’s compute, and the share of fixes approved without edits.
When you DON’T need ZeroOps
| Scenario | Better approach |
|---|---|
| Team of 1-2 people, few pipelines | Basic DataOps + alerts |
| Experimental or ad-hoc pipelines | Interactive notebooks |
| You don’t have Unity Catalog set up | Governance first, ZeroOps later |
| Your organization requires manual approval of every change | ZeroOps has human-in-the-loop, but verify it meets your compliance |
| Very tight budget | Job Clusters + cron + manual alerts |
Disclaimer: we couldn’t try it
Genie ZeroOps is in Private Preview. There’s no public access, no free trial, no sandbox to play with. Everything we cover in this post comes from the official Databricks documentation, the DAIS 2026 sessions, and third-party sources.
We haven’t seen the UI in person, haven’t tried the sandbox, haven’t validated the quality of the fixes. Until you use it on your own pipelines, it’s marketing. When it’s available in GA (or public preview), we’ll do a follow-up post with real tests and an honest opinion.
My take: does it change the game?
If it works as promised, Genie ZeroOps is the most important feature of DAIS 2026 for engineers who operate pipelines in production. Not because it’s revolutionary as a concept — PagerDuty, Datadog, and Monte Carlo have been doing pieces of this for years. What’s new is having it native, with access to the full lineage, first-hand telemetry, and an integrated sandbox that requires no configuration.
The positioning difference matters: most agent vendors aim at the build layer (writing code faster) or the use layer (asking questions about data). ZeroOps aims at the operate layer — the one nobody wants to touch but where the most time is lost.
The human-in-the-loop is key. Without it, nobody would trust it. The real question isn’t whether ZeroOps can detect and propose fixes — it’s how much of the 80% of maintenance it can automate in practice. We’ll only know that when we try it.
I’ll test it and report back.
References
- Introducing Genie ZeroOps — Databricks Blog
- Databricks targets AI operations bottlenecks with ZeroOps — InfoWorld
- Genie ZeroOps: Automatic Diagnosis and Remediation — TalentBricks
- Genie ZeroOps shifts engineers from firefighting — CompleteAITraining
- DAIS session: Genie ZeroOps for Data Quality and Compliance at Scale
- Lakeflow: A new era of agentic data engineering — Databricks Blog
- Databricks Launches Genie One — Press Release
In the next installment of Databricks Tips we’ll keep digging into the Databricks ecosystem. If you have access to the ZeroOps Private Preview and want to share your experience, write to me — I’d love to do the follow-up with real data.