Databricks Tips #8: Jobs & Workflows — streaming and triggers that start on their own
Databricks Tips
Data Engineering
Streaming
File arrival triggers, table update triggers, Trigger.AvailableNow, Job Clusters and the limitations that aren’t in the tutorial.
Hands-on lab — AutoLoader + AvailableNow + bronze→silver micro-batch with CDF. Runnable on Databricks Free Edition.
Databricks has four ways to trigger a Job automatically. Two of them — file arrival and table update — are event-driven and let you build streaming pipelines without leaving a cluster running 24/7. But they have limitations that aren’t in the 5-minute tutorial.
In this post we’ll look at how they work, when to use them, and the mistakes that will cost you hours.
Jobs in 2 minutes
A Job in Databricks is a scheduled unit of execution. Think of it as a cron job on steroids: it can have multiple Tasks (notebooks, Python scripts, SQL, JARs, DLT pipelines), each with its own dependencies, all orchestrated as a DAG.
The key difference from an interactive notebook:
| Interactive notebook | Job | |
|---|---|---|
| Compute | All-Purpose Cluster (always on) | Job Cluster (spins up and shuts down) |
| Execution | Manual, ad-hoc | Automatic, scheduled or event-driven |
| Cost | You pay while it’s on | You pay only for what you use |
| Use | Exploration, development | Production |
The analogy: an interactive notebook is like leaving the kitchen on all day in case you feel like cooking. A Job is like lighting the stove only when the ingredients are ready.
The 4 triggers
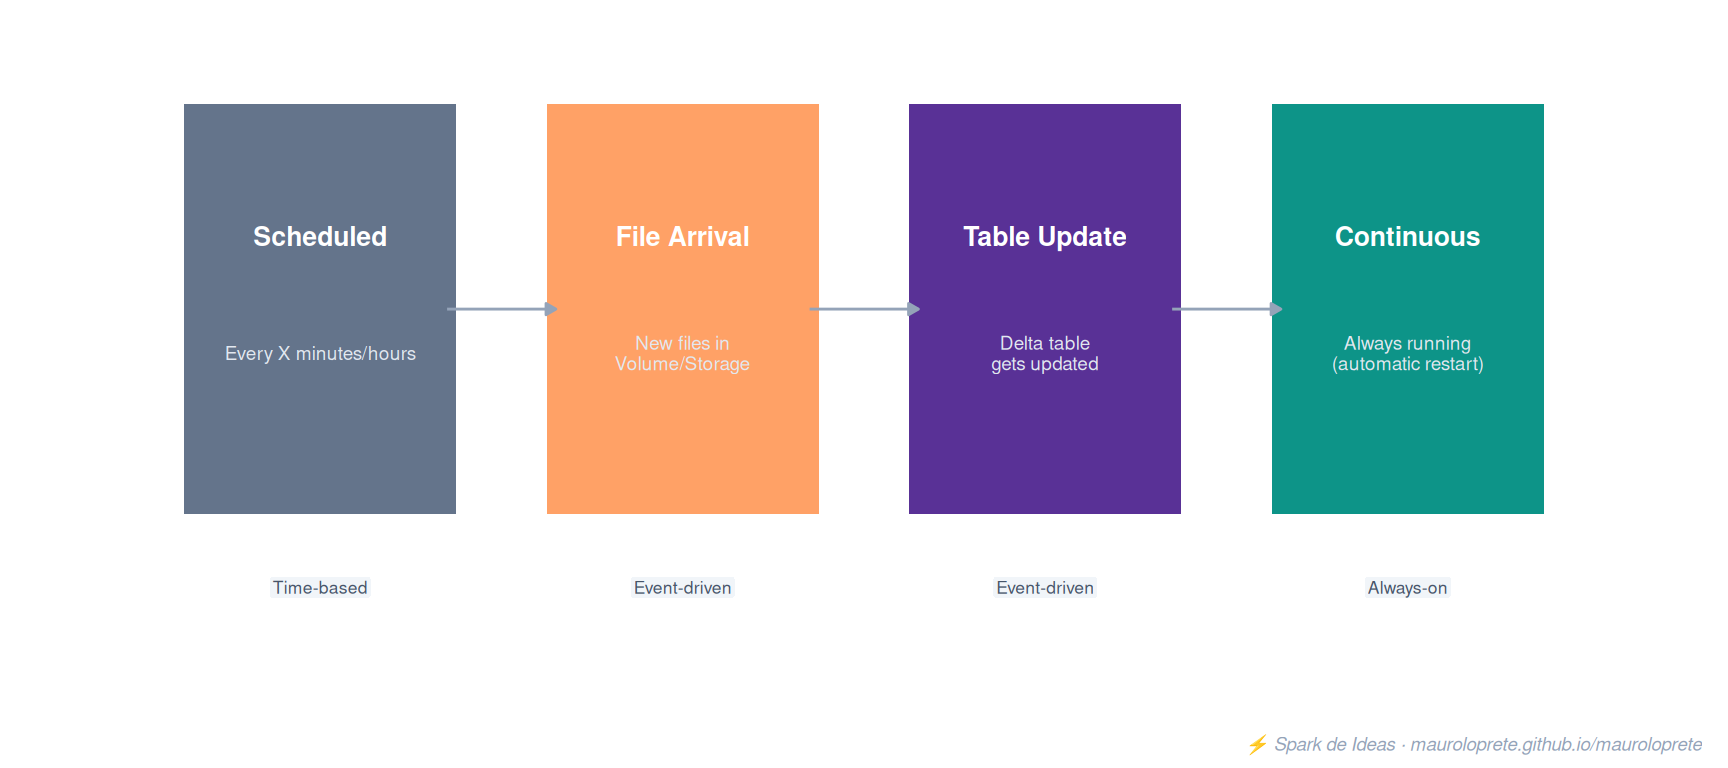
Databricks offers four trigger types to fire Jobs automatically:
| Trigger | Fires when… | Typical latency | Compute cost |
|---|---|---|---|
| Scheduled | The configured time passes (cron) | Fixed (per schedule) | Low if sporadic |
| File Arrival | New files land in a Volume or external location | ~1 min (with file events) | Only when there’s data |
| Table Update | A Delta/Iceberg table gets updated | ~1 min (with file events) | Only when there’s data |
| Continuous | Always (automatic restart on finish) | Sub-60 sec | High (cluster always alive) |
The two we care about today are File Arrival and Table Update: event-driven, efficient, and with traps that aren’t obvious.
Job Clusters: why always in production
Before diving into triggers, we need to talk about where your Job runs. Because if you use an event-driven trigger with an All-Purpose Cluster… you’re throwing money away.
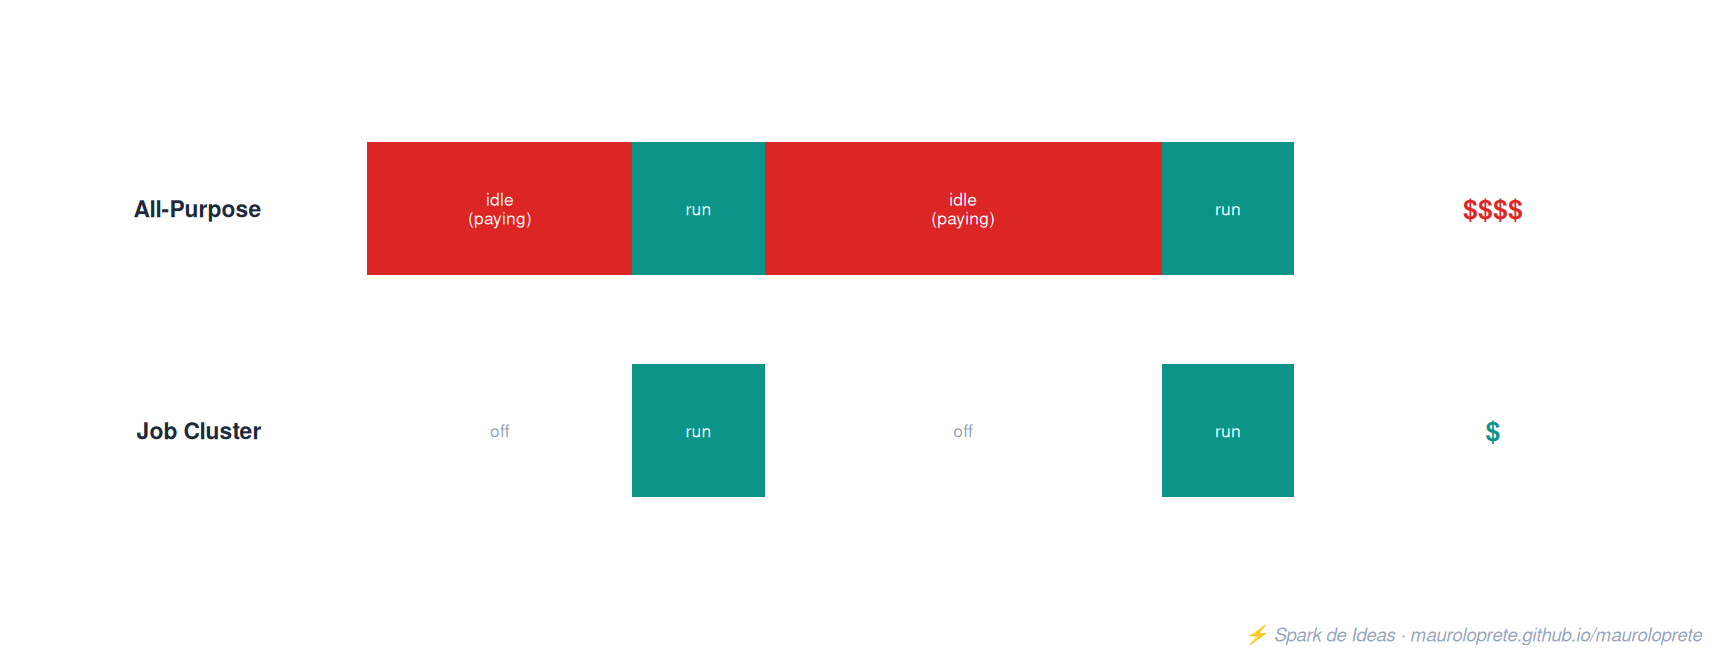
Job Cluster = created when the Job starts, destroyed when it finishes. You pay only for execution time.
All-Purpose Cluster = always on (or with auto-termination). You pay for every minute it’s alive, whether you run anything or not.
For event-driven pipelines, the math is simple:
- If your data arrives every 3 hours → the Job Cluster runs ~15 min per run → you pay ~1 hour/day
- With All-Purpose → you pay 24 hours/day (or however long until auto-terminate, and then it’s slow to come back up)
Rule: in production, always Job Cluster. All-Purpose is for interactive development.
TipTip: Instance Pools
If the Job Cluster startup feels slow (~5 min), use Instance Pools. They keep pre-warmed VMs and cut startup down to ~1-2 min.
File Arrival Trigger
The file arrival trigger monitors a Unity Catalog Volume or an external location and fires your Job when it detects new files. It checks every ~1 minute (best effort).
Setup
- In Jobs & Pipelines, select your Job
- In Schedules & Triggers → Add trigger → File arrival
- In Storage location, enter the Volume path:
/Volumes/mi_catalogo/mi_schema/mi_volume/bronze/- Configure the advanced options:
- Minimum time between triggers (seconds): minimum time between runs. If files arrive during this window, they accumulate and fire a single run when it ends.
- Wait after last change (seconds): waits X seconds after the last new file. If another file arrives, the timer resets. Useful when files arrive in batches.
- Click Test connection to validate → Save
Recursive monitoring
The trigger monitors every subdirectory of the configured path. If you configure /Volumes/catalog/schema/volume/bronze/, it also detects files in:
/Volumes/catalog/schema/volume/bronze/2026/06/
/Volumes/catalog/schema/volume/bronze/2026/06/09/
/Volumes/catalog/schema/volume/bronze/clientes/
File events
For better performance, enable file events on the external location. Without file events, Databricks does file listing (polling). With file events, it uses cloud provider notifications (Azure Event Grid, AWS S3 Events) — detection drops from minutes to seconds.
ImportantImportant: enable file events
Without file events enabled, you’re capped at 50 triggers per workspace and 10,000 files per monitored path. With file events, those limits disappear. Enabling them is a one-time setup on the external location.
File Arrival Trigger limitations
Here’s where the documentation gets interesting. These are the traps:
| Limitation | With file events | Without file events |
|---|---|---|
| Files per path | No limit | Max 10,000 |
| Triggers per workspace | No documented limit | Max 50 |
| Overwrites | Don’t fire | Don’t fire |
| Detection | Seconds | ~1 min (best effort) |
The ones that hurt
1. Overwrites don’t fire runs. If you overwrite a file with the same name, the trigger never finds out. This is by design, not a bug. If your upstream process does PUT on the same file, you need another strategy (timestamped file names, or a table update trigger on the target table).
2. Timeouts from changes outside your subpath. With file events enabled, if you configure the trigger on a subpath of an external location (e.g. /bronze/clientes/), changes in other subpaths of the same external location (e.g. /bronze/ventas/, /bronze/productos/) can generate metadata the trigger needs to process. In environments with lots of churn, this can cause a timeout and an error state.
Solution: create a dedicated Unity Catalog Volume pointing specifically at the directory you want to monitor. That isolates the trigger from the noise.
3. Ghost paths on S3/GCS. If the configured directory doesn’t exist or was deleted on S3 or GCS, the trigger keeps evaluating without erroring. It doesn’t fail, it doesn’t notify you — it simply finds no files and fires no runs. On Azure (ADLS), it does error out.
4. ADLS and FlushWithClose. On Azure, file events listens for the FlushWithClose event to detect new files. Some Azure APIs don’t emit this event, which can delay detection. If your files arrive through an API that doesn’t emit FlushWithClose, you’ll have to look into classic file notification mode.
Table Update Trigger
The table update trigger monitors Unity Catalog tables and fires your Job when it detects changes (inserts, updates, merges, deletes).
Supported tables
- Delta managed tables (Unity Catalog)
- Iceberg managed tables (Unity Catalog)
- External tables backed by Delta Lake
- Materialized views
- Streaming tables
- UC views and metric views (with restrictions — see limitations)
- Delta Sharing tables and system tables (Beta)
Setup
- In Jobs & Pipelines, select your Job
- Add trigger → Table update
- Add the tables to monitor (up to 10)
- If you select more than one, choose the mode:
- Any table is updated: fires when any of them changes
- All tables are updated: fires when all of them changed
- Advanced options (same pattern as file arrival):
- Minimum time between triggers
- Wait after last change
- Test trigger → Save
Dynamic parameters
When you use table update triggers, Databricks injects parameters you can use in your notebook:
# Which tables were updated (JSON list)
updated = dbutils.widgets.get("job.trigger.table_update.updated_tables")

# Timestamp of the last commit that fired the trigger
ts = dbutils.widgets.get(
    "job.trigger.table_update.mi_catalogo.mi_schema.mi_tabla.commit_timestamp.iso_datetime"
)

# Version of the last commit
version = dbutils.widgets.get(
    "job.trigger.table_update.mi_catalogo.mi_schema.mi_tabla.version"
)
These parameters let you do smart incremental processing: you only process what changed since the last run.
Table Update Trigger limitations
| Limitation | Detail |
|---|---|
| Tables per trigger | Max 10 |
| Views | Dependencies count as tables. A view with 11 underlying tables = can’t be used |
| Dependent views | Max 10 dependent views per monitored view |
| False positives on views | Changes filtered out by the view still fire the job |
| Without file events | Max 1,000 jobs with a table update trigger per workspace |
| Delta Sharing | Databricks-to-Databricks only (Beta). Open sharing not supported |
The view trap
If you monitor a view that filters with WHERE region = 'LATAM', and someone updates rows with region = 'EU'… the trigger fires anyway. Databricks monitors the underlying tables, not the view’s result. Your Job will run for nothing.
And worse: if your view depends on 6 tables and you add another view depending on 5 tables to the same trigger, you’re already at 11 — and the trigger fails.
Tip: use tables directly in the trigger, not views. It’s more predictable.
Trigger.AvailableNow — the trigger you’re missing
When you combine an event-driven trigger with a Job, you need your streaming code to process everything pending and finish. If you use Trigger.ProcessingTime("10 seconds"), your stream keeps running indefinitely and the Job never ends (and the Job Cluster never shuts down).
Trigger.AvailableNow is the solution:
(spark.readStream
    .format("cloudFiles")
    .option("cloudFiles.format", "json")
    .option("cloudFiles.schemaLocation", checkpoint_path)
    .load(source_path)
    .writeStream
    .option("checkpointLocation", checkpoint_path)
    .trigger(availableNow=True)    # <-- processes everything and finishes
    .toTable("catalog.schema.mi_tabla_bronze")
)
Comparison
| Trigger | Behavior | Job Cluster shuts down? | Serverless? |
|---|---|---|---|
availableNow=True |
Processes everything pending → finishes | Yes | Yes |
processingTime="10s" |
Runs micro-batches every 10s → never finishes | No | No |
once=True |
Processes a single micro-batch → finishes | Yes | Yes |
continuous |
Continuous processing, ~1ms latency | No | No |
Trigger.Once is deprecated: it only processes one micro-batch, not everything pending. If 10,000 files arrived, once=True processes one batch and leaves the rest for the next run. AvailableNow processes everything.
Why AvailableNow is perfect for Jobs
The flow is:
- Files arrive / table gets updated → trigger fires
- Job Cluster is created (~2-5 min, or ~1 min with Instance Pools)
- Your notebook runs the stream with
availableNow=True - It processes everything accumulated since the last checkpoint
- Stream finishes → Job Cluster is destroyed → you stop paying
This is streaming in efficient batch mode: you get the exactly-once guarantees of Structured Streaming (checkpoints), but without the cost of a 24/7 cluster.
NoteNote: Serverless
On serverless compute, only Trigger.AvailableNow works for Structured Streaming. ProcessingTime and Trigger.Continuous are not supported. One more reason to use AvailableNow.
Continuous mode + Streaming
If you need sub-minute latency, continuous mode is another option. You configure the Job as Continuous and Databricks automatically restarts the run when it finishes (with a delay of < 60 seconds).
# With continuous mode, you use AvailableNow
# The Job Cluster restarts automatically when it finishes
(spark.readStream
    .format("delta")
    .table("catalog.schema.bronze")
    .writeStream
    .option("checkpointLocation", checkpoint_path)
    .trigger(availableNow=True)
    .toTable("catalog.schema.silver")
)
The retry uses exponential backoff: if the task fails, it retries with increasing delays (maximum 3 retries per task). If it keeps failing, it cancels the run and starts a new one.
Continuous vs AvailableNow + event-driven trigger
| Continuous + AvailableNow | File Arrival/Table Update + AvailableNow | |
|---|---|---|
| Latency | Sub-60 sec (delay between runs) | 1-5 min (detection + cluster startup) |
| Cost | High (cluster always alive*) | Low (cluster only when there’s data) |
| Complexity | Low (no trigger to configure) | Medium (configure trigger + file events) |
| Ideal for | High-frequency streams | Data that arrives sporadically |
* In continuous mode the cluster is always active because runs restart automatically.
Practical rule: if your data arrives every 5+ minutes, use an event-driven trigger. If it arrives constantly (Kafka, IoT), use continuous or go straight to Lakeflow Declarative Pipelines.
Example: AutoLoader + File Arrival + AvailableNow
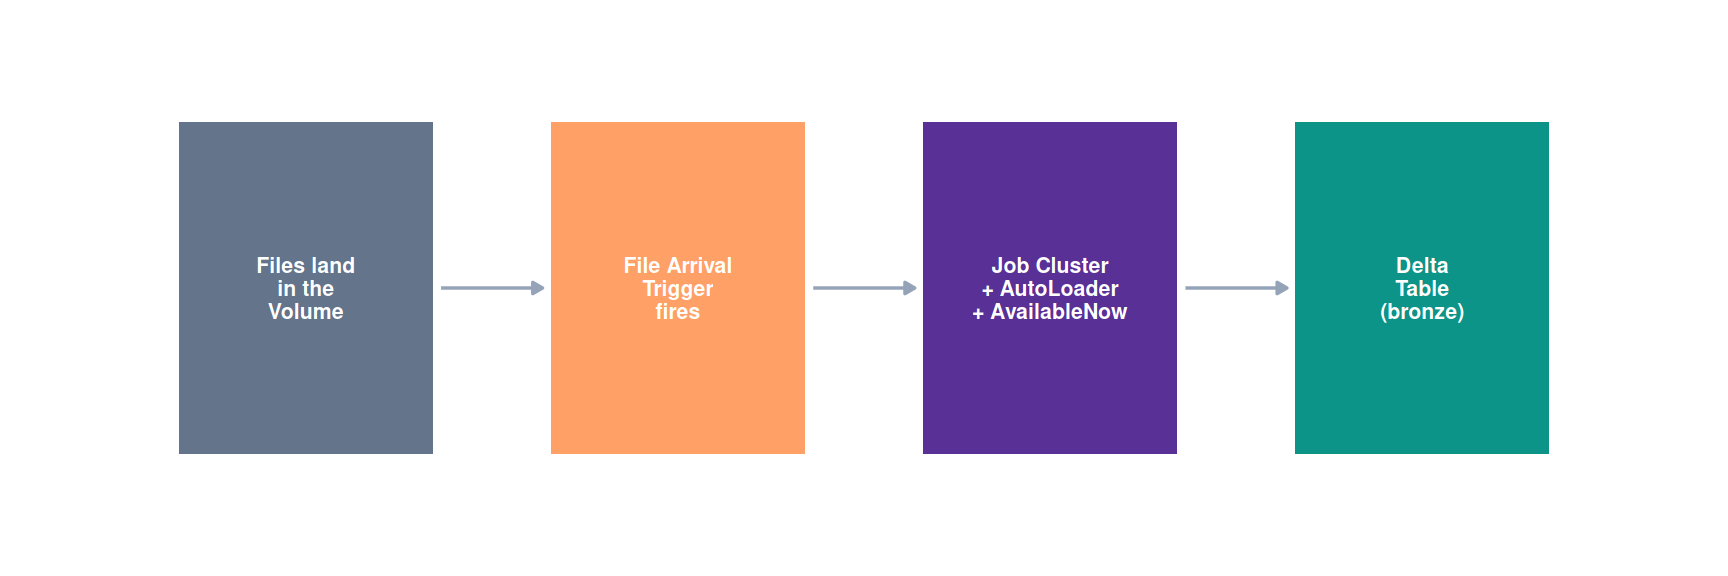
The most common scenario: JSON files land in a Unity Catalog Volume and you want to ingest them into a Delta table.
Notebook code
# Configuration
volume_path = "/Volumes/mi_catalogo/mi_schema/bronze/clientes/"
checkpoint_path = "/Volumes/mi_catalogo/mi_schema/checkpoints/clientes_bronze/"
target_table = "mi_catalogo.mi_schema.clientes_bronze"

# AutoLoader: discovers new files incrementally
(spark.readStream
    .format("cloudFiles")
    .option("cloudFiles.format", "json")
    .option("cloudFiles.schemaLocation", checkpoint_path)
    .option("cloudFiles.useManagedFileEvents", "true")  # uses file events
    .option("cloudFiles.inferColumnTypes", "true")
    .load(volume_path)
    .writeStream
    .option("checkpointLocation", checkpoint_path)
    .option("mergeSchema", "true")   # handles schema evolution
    .trigger(availableNow=True)
    .toTable(target_table)
)
What’s happening here?
- The file arrival trigger detects new files in the Volume
- It fires the Job → a Job Cluster is created
- AutoLoader (
cloudFiles) discovers the new files since the last checkpoint availableNow=Trueprocesses everything pending and finishes- The Job Cluster is destroyed → you stop paying
The checkpoint guarantees exactly-once: if the Job fails halfway through, on restart it picks up where it left off.
Variant with foreachBatch (custom logic)
If you need to do more than write to a table (e.g. call an API, validate data, merge):
def procesar_batch(batch_df, batch_id):
    # Validations
    df_valido = batch_df.filter("email IS NOT NULL AND cantidad > 0")
    df_invalido = batch_df.filter("email IS NULL OR cantidad <= 0")

    # Write valid rows to bronze
    df_valido.write.mode("append").saveAsTable("catalog.schema.clientes_bronze")

    # Write rejected rows to quarantine
    df_invalido.write.mode("append").saveAsTable("catalog.schema.clientes_quarantine")

(spark.readStream
    .format("cloudFiles")
    .option("cloudFiles.format", "json")
    .option("cloudFiles.schemaLocation", checkpoint_path)
    .option("cloudFiles.useManagedFileEvents", "true")
    .load(volume_path)
    .writeStream
    .foreachBatch(procesar_batch)
    .option("checkpointLocation", checkpoint_path)
    .trigger(availableNow=True)
    .start()
)
WarningWatch out for
foreachBatch
foreachBatch gives at-least-once guarantees, not exactly-once. If the Job fails and restarts, it may reprocess a batch. Design your logic to be idempotent (e.g. use MERGE instead of INSERT).
Example: Micro-batch with Table Update
Scenario: the bronze table gets updated (by the pipeline from the previous example, or by another process). You want to transform the new data and write it to silver.
Step 1: Enable Change Data Feed on the bronze table
ALTER TABLE mi_catalogo.mi_schema.clientes_bronze
SET TBLPROPERTIES (delta.enableChangeDataFeed = true);
Step 2: Configure the table update trigger
On the silver Job, add a Table Update trigger monitoring mi_catalogo.mi_schema.clientes_bronze with the Any table is updated mode.
Step 3: Transformation notebook
checkpoint_path = "/Volumes/mi_catalogo/mi_schema/checkpoints/clientes_silver/"

(spark.readStream
    .format("delta")
    .option("readChangeFeed", "true")   # reads only the changes (CDF)
    .table("mi_catalogo.mi_schema.clientes_bronze")
    .filter("_change_type IN ('insert', 'update_postimage')")
    .drop("_change_type", "_commit_version", "_commit_timestamp")
    .withColumn("nombre_upper", F.upper(F.col("nombre")))
    .withColumn("procesado_at", F.current_timestamp())
    .writeStream
    .option("checkpointLocation", checkpoint_path)
    .trigger(availableNow=True)
    .toTable("mi_catalogo.mi_schema.clientes_silver")
)
Using the trigger’s dynamic parameters
Optionally, you can use the parameters Databricks injects for logging or auditing:
# Which tables were updated
updated_tables = dbutils.widgets.get("job.trigger.table_update.updated_tables")
print(f"Updated tables: {updated_tables}")

# Version of the commit that fired the trigger
trigger_version = dbutils.widgets.get(
    "job.trigger.table_update.mi_catalogo.mi_schema.clientes_bronze.version"
)
print(f"Processing from version: {trigger_version}")
Gotchas
1. Cluster startup kills your latency. A Job Cluster takes ~3-5 minutes to start. If your trigger detects data in 1 minute but the cluster takes 5 to spin up, your real latency is 6 minutes. Solution: Instance Pools or serverless compute.
2. File events not enabled = degraded mode. Without file events, you’re limited to 50 triggers and 10,000 files. And detection is by polling (file listing), not notification. Enable file events on the external location — it’s free and it’s a one-time setup.
3. Overwrites are invisible. If your upstream process overwrites files instead of creating new ones, the file arrival trigger never finds out. Switch the strategy to timestamped file names, or use a table update trigger on the target table.
4. Views that over-fire. We already saw it: if you monitor a view with a table update trigger, any change in the underlying tables fires the job, even if the view shows no new data. Use tables directly.
5. Serverless doesn’t support ProcessingTime. If you migrate to serverless compute and your notebook uses trigger(processingTime="10 seconds"), it will fail. Change it to trigger(availableNow=True).
6. Don’t use All-Purpose Clusters for this. We already said it, but it’s worth repeating: if your trigger fires 4 times a day and each run takes 15 minutes, with a Job Cluster you pay 1 hour. With All-Purpose you pay 24. The difference at the end of the month hurts.
When NOT to use Jobs for streaming
Jobs with event-driven triggers are ideal for micro-batch streaming: data arriving every few minutes/hours, where minute-level latency is acceptable.
But they’re not always the best option:
| Scenario | Better option |
|---|---|
| Sub-second latency (Kafka, IoT) | Lakeflow Declarative Pipelines (continuous mode) |
| Pipeline with quality gates and expectations | Lakeflow Declarative Pipelines (expectations) |
| Cross-workspace or multi-cloud orchestration | Airflow / external orchestrator |
| Simple, frequent ETL (every 5 min) | Jobs with a scheduled trigger (simpler) |
References
- Automating jobs with schedules and triggers — Azure Databricks
- Trigger jobs when new files arrive — Azure Databricks
- Trigger jobs when source tables are updated — Azure Databricks
- Run jobs continuously — Azure Databricks
- Configure Structured Streaming trigger intervals — Azure Databricks
- Auto Loader — Azure Databricks
- Use Delta Lake change data feed — Azure Databricks
- Instance Pools — Azure Databricks
Other posts in the series
If this post helped you, check out the previous Databricks Tips:
- Tips #1: Databricks Asset Bundles — advanced DABs patterns, complex variables, multi-target deploys.
- Tips #2: Delta Lake — Liquid Clustering, OPTIMIZE, VACUUM, and the 7 things I wish someone had told me earlier.
- Tips #3: Unity Catalog — governance model, inherited GRANTS, row/column security.
- Tips #4: Structured Streaming — watermarks, windows, state and the problems the documentation doesn’t tell you about.
- Tips #5: MLflow + Unity Catalog — unified model registry, lineage and deployment from UC.
- Tips #6: Feature Engineering — Feature Store, online tables, point-in-time lookups.
- Tips #7: Docker on Databricks — DCS, golden containers, CI/CD with custom images.
Next week: SQL Warehouses & Serverless — on-demand compute that scales on its own for analytics and BI.